
Create successful ePaper yourself
Turn your PDF publications into a flip-book with our unique Google optimized e-Paper software.
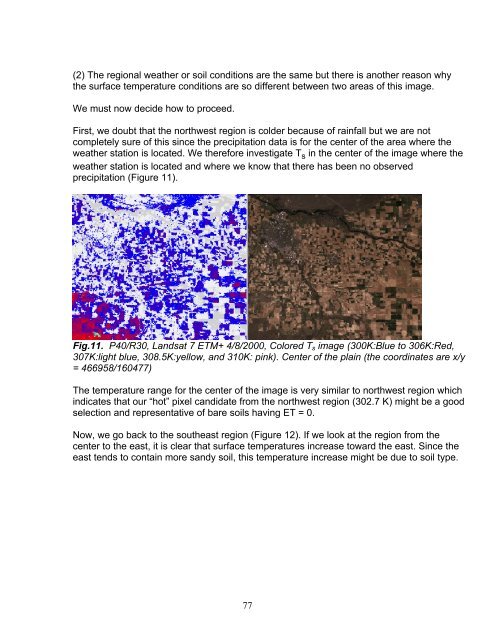
(2) The regional weather or soil conditions are the same but there is another reason whythe surface temperature conditions are so different between two areas of this image.We must now decide how to proceed.First, we doubt that the northwest region is colder because of rainfall but we are notcompletely sure of this since the precipitation data is for the center of the area where theweather station is located. We therefore investigate T s in the center of the image where theweather station is located and where we know that there has been no observedprecipitation (Figure 11).Fig.11. P40/R30, Landsat 7 ETM+ 4/8/2000, Colored T s image (300K:Blue to 306K:Red,307K:light blue, 308.5K:yellow, and 310K: pink). Center of the plain (the coordinates are x/y= 466958/160477)The temperature range for the center of the image is very similar to northwest region whichindicates that our “hot” pixel candidate from the northwest region (302.7 K) might be a goodselection and representative of bare soils having ET = 0.Now, we go back to the southeast region (Figure 12). If we look at the region from thecenter to the east, it is clear that surface temperatures increase toward the east. Since theeast tends to contain more sandy soil, this temperature increase might be due to soil type.77