You also want an ePaper? Increase the reach of your titles
YUMPU automatically turns print PDFs into web optimized ePapers that Google loves.
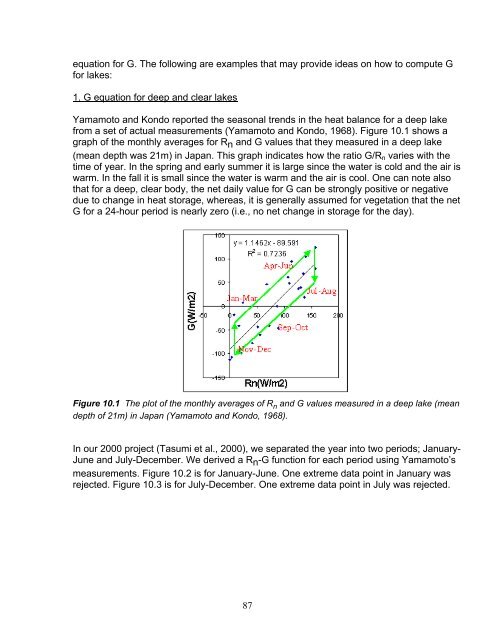
equation for G. The following are examples that may provide ideas on how to compute Gfor lakes:1. G equation for deep and clear lakesYamamoto and Kondo reported the seasonal trends in the heat balance for a deep lakefrom a set of actual measurements (Yamamoto and Kondo, 1968). Figure 10.1 shows agraph of the monthly averages for Rn and G values that they measured in a deep lake(mean depth was 21m) in Japan. This graph indicates how the ratio G/R n varies with thetime of year. In the spring and early summer it is large since the water is cold and the air iswarm. In the fall it is small since the water is warm and the air is cool. One can note alsothat for a deep, clear body, the net daily value for G can be strongly positive or negativ<strong>edu</strong>e to change in heat storage, whereas, it is generally assumed for vegetation that the netG for a 24-hour period is nearly zero (i.e., no net change in storage for the day).Figure 10.1 The plot of the monthly averages of R n and G values measured in a deep lake (meandepth of 21m) in Japan (Yamamoto and Kondo, 1968).In our 2000 project (Tasumi et al., 2000), we separated the year into two periods; January-June and July-December. We derived a Rn-G function for each period using Yamamoto’smeasurements. Figure 10.2 is for January-June. One extreme data point in January wasrejected. Figure 10.3 is for July-December. One extreme data point in July was rejected.87


