
Create successful ePaper yourself
Turn your PDF publications into a flip-book with our unique Google optimized e-Paper software.
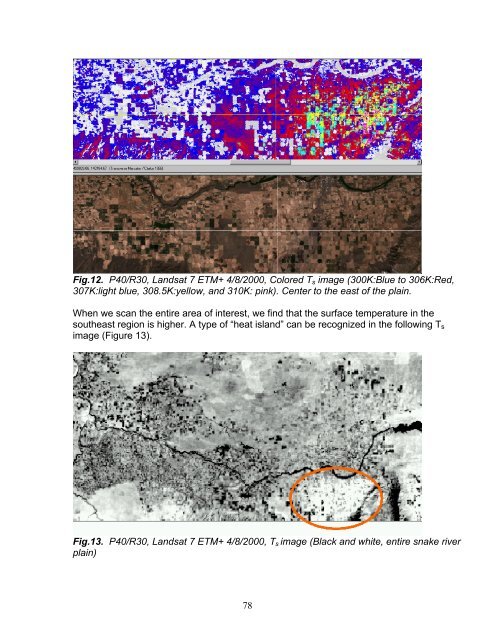
Fig.12. P40/R30, Landsat 7 ETM+ 4/8/2000, Colored T s image (300K:Blue to 306K:Red,307K:light blue, 308.5K:yellow, and 310K: pink). Center to the east of the plain.When we scan the entire area of interest, we find that the surface temperature in thesoutheast region is higher. A type of “heat island” can be recognized in the following T simage (Figure 13).Fig.13. P40/R30, Landsat 7 ETM+ 4/8/2000, T s image (Black and white, entire snake riverplain)78