Create successful ePaper yourself
Turn your PDF publications into a flip-book with our unique Google optimized e-Paper software.
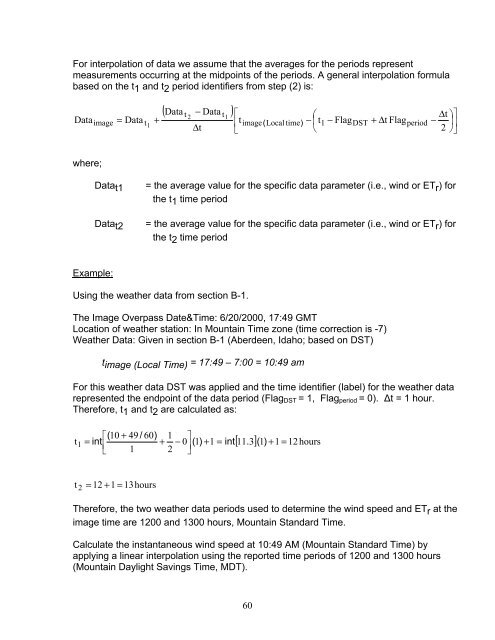
For interpolation of data we assume that the averages for the periods representmeasurements occurring at the midpoints of the periods. A general interpolation formulabased on the t1 and t2 period identifiers from step (2) is:Dataimage= Data( Data − Data )∆t⎡⎢t⎣t 2 t1t +1 image(Local time)⎛− ⎜ t⎝1− FlagDST+ ∆tFlagperiod∆t⎞⎤− ⎟2⎥⎠⎦where;Datat1Datat2= the average value for the specific data parameter (i.e., wind or ETr) forthe t1 time period= the average value for the specific data parameter (i.e., wind or ETr) forthe t2 time periodExample:Using the weather data from section B-1.The Image Overpass Date&Time: 6/20/2000, 17:49 GMTLocation of weather station: In Mountain Time zone (time correction is -7)Weather Data: Given in section B-1 (Aberdeen, Idaho; based on DST)t image (Local Time) = 17:49 – 7:00 = 10:49 amFor this weather data DST was applied and the time identifier (label) for the weather datarepresented the endpoint of the data period (Flag DST = 1, Flag period = 0). ∆t = 1 hour.Therefore, t1 and t2 are calculated as:⎡(10 + 49 / 60)1 ⎤t 1 = int ⎢+ − 0 1 + 1 ==1 2 ⎥() int )⎣⎦[ 11.3] ( 1 + 1 12hourst 2 = 12 + 1 = 13hoursTherefore, the two weather data periods used to determine the wind speed and ETr at theimage time are 1200 and 1300 hours, Mountain Standard Time.Calculate the instantaneous wind speed at 10:49 AM (Mountain Standard Time) byapplying a linear interpolation using the reported time periods of 1200 and 1300 hours(Mountain Daylight Savings Time, MDT).60


