
Create successful ePaper yourself
Turn your PDF publications into a flip-book with our unique Google optimized e-Paper software.
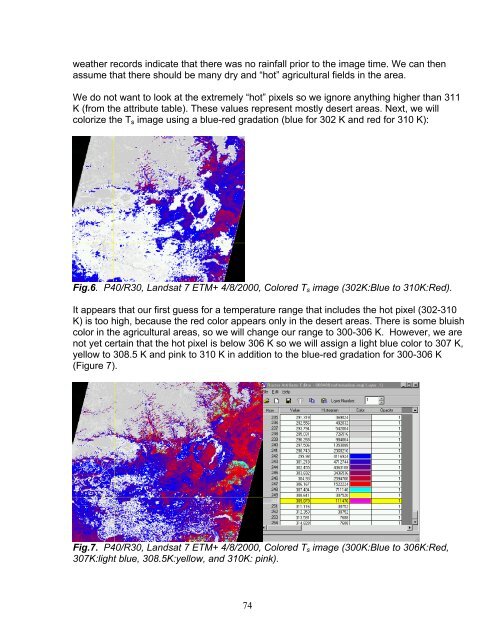
weather records indicate that there was no rainfall prior to the image time. We can thenassume that there should be many dry and “hot” agricultural fields in the area.We do not want to look at the extremely “hot” pixels so we ignore anything higher than 311K (from the attribute table). These values represent mostly desert areas. Next, we willcolorize the T s image using a blue-red gradation (blue for 302 K and red for 310 K):Fig.6. P40/R30, Landsat 7 ETM+ 4/8/2000, Colored T s image (302K:Blue to 310K:Red).It appears that our first guess for a temperature range that includes the hot pixel (302-310K) is too high, because the red color appears only in the desert areas. There is some bluishcolor in the agricultural areas, so we will change our range to 300-306 K. However, we arenot yet certain that the hot pixel is below 306 K so we will assign a light blue color to 307 K,yellow to 308.5 K and pink to 310 K in addition to the blue-red gradation for 300-306 K(Figure 7).Fig.7. P40/R30, Landsat 7 ETM+ 4/8/2000, Colored T s image (300K:Blue to 306K:Red,307K:light blue, 308.5K:yellow, and 310K: pink).74