
Create successful ePaper yourself
Turn your PDF publications into a flip-book with our unique Google optimized e-Paper software.
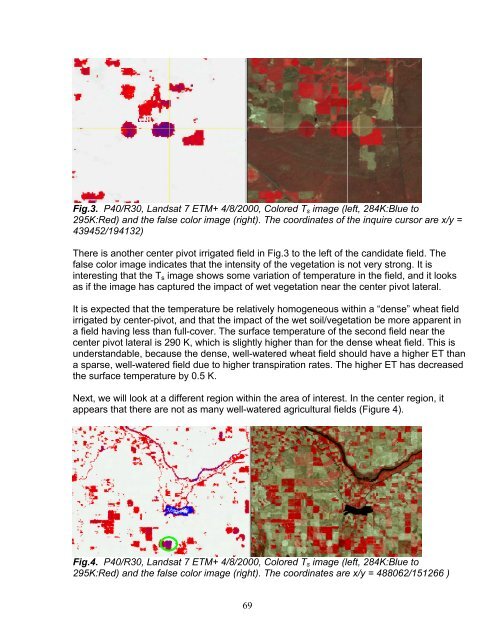
Fig.3. P40/R30, Landsat 7 ETM+ 4/8/2000, Colored T s image (left, 284K:Blue to295K:Red) and the false color image (right). The coordinates of the inquire cursor are x/y =439452/194132)There is another center pivot irrigated field in Fig.3 to the left of the candidate field. Thefalse color image indicates that the intensity of the vegetation is not very strong. It isinteresting that the T s image shows some variation of temperature in the field, and it looksas if the image has captured the impact of wet vegetation near the center pivot lateral.It is expected that the temperature be relatively homogeneous within a “dense” wheat fieldirrigated by center-pivot, and that the impact of the wet soil/vegetation be more apparent ina field having less than full-cover. The surface temperature of the second field near thecenter pivot lateral is 290 K, which is slightly higher than for the dense wheat field. This isunderstandable, because the dense, well-watered wheat field should have a higher ET thana sparse, well-watered field due to higher transpiration rates. The higher ET has decreasedthe surface temperature by 0.5 K.Next, we will look at a different region within the area of interest. In the center region, itappears that there are not as many well-watered agricultural fields (Figure 4).Fig.4. P40/R30, Landsat 7 ETM+ 4/8/2000, Colored T s image (left, 284K:Blue to295K:Red) and the false color image (right). The coordinates are x/y = 488062/151266 )69