
You also want an ePaper? Increase the reach of your titles
YUMPU automatically turns print PDFs into web optimized ePapers that Google loves.
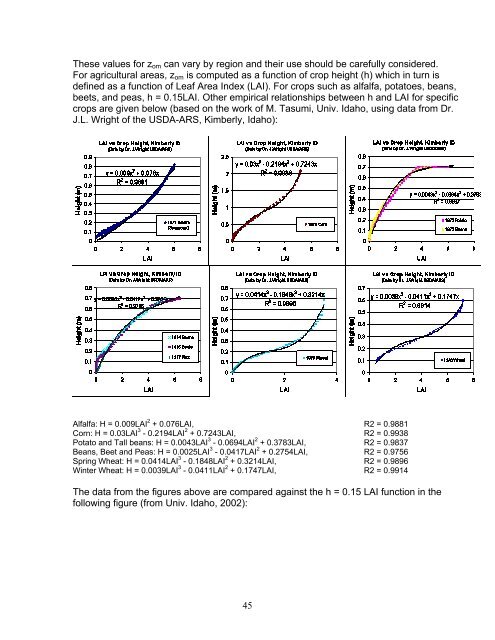
These values for z om can vary by region and their use should be carefully considered.For agricultural areas, z om is computed as a function of crop height (h) which in turn isdefined as a function of Leaf Area Index (LAI). For crops such as alfalfa, potatoes, beans,beets, and peas, h = 0.15LAI. Other empirical relationships between h and LAI for specificcrops are given below (based on the work of M. Tasumi, Univ. Idaho, using data from Dr.J.L. Wright of the USDA-ARS, Kimberly, Idaho):Alfalfa: H = 0.009LAI 2 + 0.076LAI, R2 = 0.9881Corn: H = 0.03LAI 3 - 0.2194LAI 2 + 0.7243LAI, R2 = 0.9938Potato and Tall beans: H = 0.0043LAI 3 - 0.0694LAI 2 + 0.3783LAI, R2 = 0.9837Beans, Beet and Peas: H = 0.0025LAI 3 - 0.0417LAI 2 + 0.2754LAI, R2 = 0.9756Spring Wheat: H = 0.0414LAI 3 - 0.1848LAI 2 + 0.3214LAI, R2 = 0.9896Winter Wheat: H = 0.0039LAI 3 - 0.0411LAI 2 + 0.1747LAI, R2 = 0.9914The data from the figures above are compared against the h = 0.15 LAI function in thefollowing figure (from Univ. Idaho, 2002):45