
You also want an ePaper? Increase the reach of your titles
YUMPU automatically turns print PDFs into web optimized ePapers that Google loves.
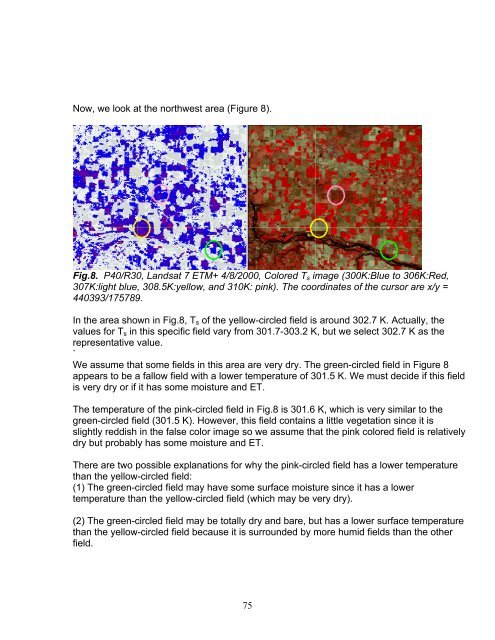
Now, we look at the northwest area (Figure 8).Fig.8. P40/R30, Landsat 7 ETM+ 4/8/2000, Colored T s image (300K:Blue to 306K:Red,307K:light blue, 308.5K:yellow, and 310K: pink). The coordinates of the cursor are x/y =440393/175789.In the area shown in Fig.8, T s of the yellow-circled field is around 302.7 K. Actually, thevalues for T s in this specific field vary from 301.7-303.2 K, but we select 302.7 K as therepresentative value.`We assume that some fields in this area are very dry. The green-circled field in Figure 8appears to be a fallow field with a lower temperature of 301.5 K. We must decide if this fieldis very dry or if it has some moisture and ET.The temperature of the pink-circled field in Fig.8 is 301.6 K, which is very similar to thegreen-circled field (301.5 K). However, this field contains a little vegetation since it isslightly reddish in the false color image so we assume that the pink colored field is relativelydry but probably has some moisture and ET.There are two possible explanations for why the pink-circled field has a lower temperaturethan the yellow-circled field:(1) The green-circled field may have some surface moisture since it has a lowertemperature than the yellow-circled field (which may be very dry).(2) The green-circled field may be totally dry and bare, but has a lower surface temperaturethan the yellow-circled field because it is surrounded by more humid fields than the otherfield.75