Finland - Jyvaskyla Region - Final Self-Evaluation Report.pdf
Finland - Jyvaskyla Region - Final Self-Evaluation Report.pdf
Finland - Jyvaskyla Region - Final Self-Evaluation Report.pdf

You also want an ePaper? Increase the reach of your titles
YUMPU automatically turns print PDFs into web optimized ePapers that Google loves.
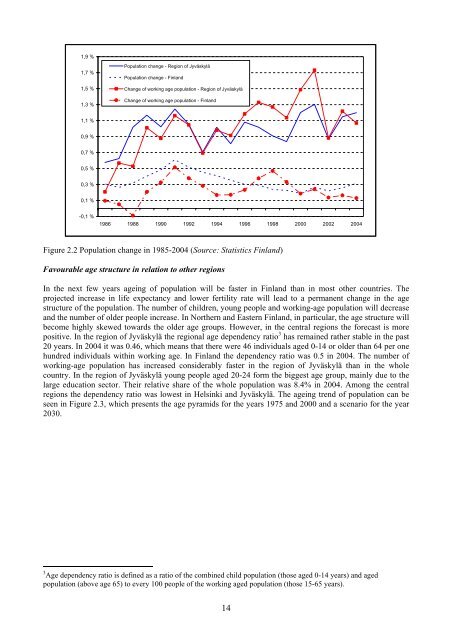
1,9 %1,7 %1,5 %1,3 %Population change - <strong>Region</strong> of JyväskyläPopulation change - <strong>Finland</strong>Change of working age population - <strong>Region</strong> of JyväskyläChange of working age population - <strong>Finland</strong>1,1 %0,9 %0,7 %0,5 %0,3 %0,1 %-0,1 %1986 1988 1990 1992 1994 1996 1998 2000 2002 2004Figure 2.2 Population change in 1985-2004 (Source: Statistics <strong>Finland</strong>)Favourable age structure in relation to other regionsIn the next few years ageing of population will be faster in <strong>Finland</strong> than in most other countries. Theprojected increase in life expectancy and lower fertility rate will lead to a permanent change in the agestructure of the population. The number of children, young people and working-age population will decreaseand the number of older people increase. In Northern and Eastern <strong>Finland</strong>, in particular, the age structure willbecome highly skewed towards the older age groups. However, in the central regions the forecast is morepositive. In the region of Jyväskylä the regional age dependency ratio 3 has remained rather stable in the past20 years. In 2004 it was 0.46, which means that there were 46 individuals aged 0-14 or older than 64 per onehundred individuals within working age. In <strong>Finland</strong> the dependency ratio was 0.5 in 2004. The number ofworking-age population has increased considerably faster in the region of Jyväskylä than in the wholecountry. In the region of Jyväskylä young people aged 20-24 form the biggest age group, mainly due to thelarge education sector. Their relative share of the whole population was 8.4% in 2004. Among the centralregions the dependency ratio was lowest in Helsinki and Jyväskylä. The ageing trend of population can beseen in Figure 2.3, which presents the age pyramids for the years 1975 and 2000 and a scenario for the year2030.3 Age dependency ratio is defined as a ratio of the combined child population (those aged 0-14 years) and agedpopulation (above age 65) to every 100 people of the working aged population (those 15-65 years).14