c<strong>on</strong>stellati<strong>on</strong> radiometers within a unified framework, and(3) physical-based precipitati<strong>on</strong> retrievals from allc<strong>on</strong>stellati<strong>on</strong> radiometers using a comm<strong>on</strong> observati<strong>on</strong>c<strong>on</strong>strainedglobal hydrometeor database c<strong>on</strong>sistent withGPM Core sensor measurements, instead <strong>of</strong> a limited set <strong>of</strong>model-generated hydrometeor database. As a science missi<strong>on</strong>with integrated applicati<strong>on</strong>s goals, GPM will provide a keymeasurement for improving understanding <strong>of</strong> global watercycle variability and freshwater availability. GPM Coresensors will <strong>of</strong>fer insights into 3-dimensi<strong>on</strong>al structures <strong>of</strong>storms, microphysical properties <strong>of</strong> precipitating particles,and latent heat associated with precipitati<strong>on</strong> processes. GPMwill also provide data in near realtime for societalapplicati<strong>on</strong>s ranging from positi<strong>on</strong> fixes <strong>of</strong> storm centers forcycl<strong>on</strong>e track predicti<strong>on</strong>, assimilati<strong>on</strong> <strong>of</strong> precipitati<strong>on</strong>informati<strong>on</strong> in operati<strong>on</strong>al wea<strong>the</strong>r forecasts, m<strong>on</strong>itoringand predicti<strong>on</strong>s for floods and landslides, to management <strong>of</strong>freshwater resources. An overview <strong>of</strong> <strong>the</strong> GPM missi<strong>on</strong>design and U.S. science activities will be presented.Ahmed, Mohamed E.Use <strong>of</strong> GRACE Data to M<strong>on</strong>itor Climate Change(El Niño / La Niña)-induced Variati<strong>on</strong>s in WaterAvailability Across <strong>the</strong> African C<strong>on</strong>tinentAhmed, Mohamed E. 1 ; Sultan, Mohamed 1 ; Wahr, John 2 ; Yan,Eugene 3 ; Milewski, Adam 5 ; Chouinard, Kyle 4 ; Mohsen, Fadi 41. Department <strong>of</strong> Geosciences, Western MichiganUniversity, Kalamazoo, MI, USA2. Physics, University <strong>of</strong> Colorado at Boulder, Boulder, CO,USA3. Envir<strong>on</strong>mental Sciences, Arg<strong>on</strong>ne Nati<strong>on</strong>al Laboratory,Arg<strong>on</strong>ne, IL, USA4. Computer Science, Western Michigan University,Kalamazoo, MI, USA5. Geology, University <strong>of</strong> Georgia, A<strong>the</strong>ns, GA, USAThe deviati<strong>on</strong> <strong>of</strong> <strong>the</strong> sea surface temperature (SST) from<strong>the</strong> normal in <strong>the</strong> equatorial Pacific Ocean is usuallyexpressed by <strong>the</strong> El Niño/ La Niña cycles where El Niño ischaracterized by unusually warm temperatures and La Niñaby unusually cool temperatures in <strong>the</strong> equatorial Pacific.These two cycles not <strong>on</strong>ly change <strong>the</strong> precipitati<strong>on</strong> patternsin <strong>the</strong> equatorial Pacific area but also introduce climatechange in remote areas around <strong>the</strong> World. Becauseprecipitati<strong>on</strong> anomalies could induce a signature <strong>on</strong> <strong>the</strong>mass distributi<strong>on</strong> <strong>on</strong> land, we explore <strong>the</strong> utility <strong>of</strong> GravityRecovery and Climate Experiment (GRACE) data toinvestigate <strong>the</strong> spatial and temporal distributi<strong>on</strong> <strong>of</strong> <strong>the</strong> areasaffected by El Niño / La Niña cycle. During <strong>the</strong> period fromApril 2002 to November 2010 four El Niño (5/2002-3/2003,6/2004/2/2005, 8/2006/1/2007, and 6/2009-4/2010) and twoLa Niña (9/2007-5/2008, and 7/2010- 4/2011) cycles wereidentified from Oceanic Nino Index (ONI). M<strong>on</strong>thly GRACEgravity field soluti<strong>on</strong>s (Center <strong>of</strong> Space Research [CSR]RL04) in form <strong>of</strong> Spherical Harm<strong>on</strong>ic Coefficients (SHC’s)that span <strong>the</strong> period from April 2002 through November2010 were processed (temporal mean was removed, destriped,smoo<strong>the</strong>d [250 km; Gaussian], and c<strong>on</strong>verted to 0.5x 0.5 deg. equivalent water thicknesses). A GIS platform wasused to examine <strong>the</strong> spatial and temporal variati<strong>on</strong>s inGRACE m<strong>on</strong>thly soluti<strong>on</strong>s and to compare <strong>the</strong>se variati<strong>on</strong>sto observati<strong>on</strong>s extracted from o<strong>the</strong>r relevant temporalremote sensing data sets (e.g., precipitati<strong>on</strong>, soil moisture),and geologic (e.g., geologic maps), hydrologic data(distributi<strong>on</strong> <strong>of</strong> lakes, streams, etc), and topographic data(landscape type and distributi<strong>on</strong>). Preliminary findingsindicate: (1) areas impacted by <strong>the</strong> El Niño cycle are thoseshowing c<strong>on</strong>sistent m<strong>on</strong>thly GRACE mass soluti<strong>on</strong> patternsthroughout each <strong>of</strong> identified four El Niño cycles and thoseaffected by <strong>the</strong> La Niña cycles show c<strong>on</strong>sistent patternsthroughout <strong>the</strong> two recorded La Niña cycles; and (2) climateinduced mass variati<strong>on</strong>s could be observed <strong>on</strong> sub-basinscales (e.g., source areas) in areas <strong>of</strong> high signal to noiseratios. Implicati<strong>on</strong>s for using GRACE data to evaluateimpacts <strong>of</strong> climate change <strong>on</strong> water availability over largedomains are clear.Alabi, Omowumi O.Validati<strong>on</strong> <strong>of</strong> TRMM Satellite Data in <strong>the</strong>Farmingt<strong>on</strong>/Du River Basin <strong>of</strong> LiberiaAlabi, Omowumi O. 1 ; Gar-Glahn, Eugene 21. Department <strong>of</strong> Satellite Meteorology, African Regi<strong>on</strong>alCentre for Space Science & Technology Educati<strong>on</strong>(ARCSSTE-E), Ile Ife, Nigeria2. Divisi<strong>on</strong> <strong>of</strong> Meteorology, Ministry <strong>of</strong> Transport,M<strong>on</strong>rovia, LiberiaThis research was focused <strong>on</strong> <strong>the</strong> Farmingt<strong>on</strong>/Du RiverBasin (latitude 6.4° North and l<strong>on</strong>gitude 10.4° West) locatedin Margibi county, <strong>on</strong>e <strong>of</strong> <strong>the</strong> 15 counties in Liberia. Thestudy compared <strong>the</strong> Tropical Rainfall Measuring Missi<strong>on</strong>(TRMM) Satellite derived m<strong>on</strong>thly precipitati<strong>on</strong>(TRMM3B42V6) with rain gauge data recorded at <strong>on</strong>emeteorological stati<strong>on</strong> in <strong>the</strong> Farmingt<strong>on</strong>/Du River Basin,and <strong>the</strong> possibility <strong>of</strong> using satellite estimated rainfall tocomplement ground-measured values. The m<strong>on</strong>thly rainfallcomparis<strong>on</strong>s showed that <strong>the</strong> TRMM rainfall trends werevery similar to <strong>the</strong> observed data trends. The correlati<strong>on</strong>between <strong>the</strong> m<strong>on</strong>thly datasets ranged from 0.75 to 0.98. Thetwo sets <strong>of</strong> data captured <strong>the</strong> phenomen<strong>on</strong> known as <strong>the</strong>‘little dry seas<strong>on</strong>’, characterized by an abnormal decrease inprecipitati<strong>on</strong> which occurred during <strong>the</strong> m<strong>on</strong>th <strong>of</strong> July at<strong>the</strong> peak <strong>of</strong> <strong>the</strong> rainy seas<strong>on</strong>. Although <strong>the</strong> overall catchmentrainfall was well represented by TRMM data, it was observedthat <strong>the</strong> annual ground measured values were ei<strong>the</strong>roverestimated or underestimated. TRMM’s persistentunderestimati<strong>on</strong>s which occurred from 1998 to 2004 weregenerally below 18% while <strong>the</strong> overestimati<strong>on</strong>s which wererecurrent between 2005 and 2009 were below 9%. This studyc<strong>on</strong>cluded that even though <strong>the</strong> TRMM precipitati<strong>on</strong> didnot perfectly match with <strong>the</strong> rain gauge data, it can still beused to supplement ground measurements and forestimating rainfalls in un-gauged basins. This is especiallyimportant in Liberia, a country where political instabilityresulted in <strong>the</strong> extincti<strong>on</strong> <strong>of</strong> almost all <strong>the</strong> fewmeteorological stati<strong>on</strong>s in <strong>the</strong> regi<strong>on</strong>.30
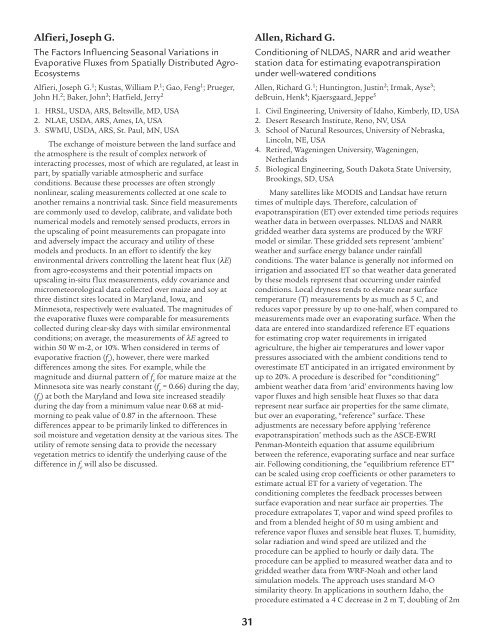
Alfieri, Joseph G.The Factors Influencing Seas<strong>on</strong>al Variati<strong>on</strong>s inEvaporative Fluxes from Spatially Distributed Agro-EcosystemsAlfieri, Joseph G. 1 ; Kustas, William P. 1 ; Gao, Feng 1 ; Prueger,John H. 2 ; Baker, John 3 ; Hatfield, Jerry 21. HRSL, USDA, ARS, Beltsville, MD, USA2. NLAE, USDA, ARS, Ames, IA, USA3. SWMU, USDA, ARS, St. Paul, MN, USAThe exchange <strong>of</strong> moisture between <strong>the</strong> land surface and<strong>the</strong> atmosphere is <strong>the</strong> result <strong>of</strong> complex network <strong>of</strong>interacting processes, most <strong>of</strong> which are regulated, at least inpart, by spatially variable atmospheric and surfacec<strong>on</strong>diti<strong>on</strong>s. Because <strong>the</strong>se processes are <strong>of</strong>ten str<strong>on</strong>glyn<strong>on</strong>linear, scaling measurements collected at <strong>on</strong>e scale toano<strong>the</strong>r remains a n<strong>on</strong>trivial task. Since field measurementsare comm<strong>on</strong>ly used to develop, calibrate, and validate bothnumerical models and remotely sensed products, errors in<strong>the</strong> upscaling <strong>of</strong> point measurements can propagate intoand adversely impact <strong>the</strong> accuracy and utility <strong>of</strong> <strong>the</strong>semodels and products. In an effort to identify <strong>the</strong> keyenvir<strong>on</strong>mental drivers c<strong>on</strong>trolling <strong>the</strong> latent heat flux (E)from agro-ecosystems and <strong>the</strong>ir potential impacts <strong>on</strong>upscaling in-situ flux measurements, eddy covariance andmicrometeorological data collected over maize and soy atthree distinct sites located in Maryland, Iowa, andMinnesota, respectively were evaluated. The magnitudes <strong>of</strong><strong>the</strong> evaporative fluxes were comparable for measurementscollected during clear-sky days with similar envir<strong>on</strong>mentalc<strong>on</strong>diti<strong>on</strong>s; <strong>on</strong> average, <strong>the</strong> measurements <strong>of</strong> E agreed towithin 50 W m-2, or 10%. When c<strong>on</strong>sidered in terms <strong>of</strong>evaporative fracti<strong>on</strong> (f e), however, <strong>the</strong>re were markeddifferences am<strong>on</strong>g <strong>the</strong> sites. For example, while <strong>the</strong>magnitude and diurnal pattern <strong>of</strong> f efor mature maize at <strong>the</strong>Minnesota site was nearly c<strong>on</strong>stant (f e= 0.66) during <strong>the</strong> day,(f e) at both <strong>the</strong> Maryland and Iowa site increased steadilyduring <strong>the</strong> day from a minimum value near 0.68 at midmorningto peak value <strong>of</strong> 0.87 in <strong>the</strong> afterno<strong>on</strong>. Thesedifferences appear to be primarily linked to differences insoil moisture and vegetati<strong>on</strong> density at <strong>the</strong> various sites. Theutility <strong>of</strong> remote sensing data to provide <strong>the</strong> necessaryvegetati<strong>on</strong> metrics to identify <strong>the</strong> underlying cause <strong>of</strong> <strong>the</strong>difference in f ewill also be discussed.Allen, Richard G.C<strong>on</strong>diti<strong>on</strong>ing <strong>of</strong> NLDAS, NARR and arid wea<strong>the</strong>rstati<strong>on</strong> data for estimating evapotranspirati<strong>on</strong>under well-watered c<strong>on</strong>diti<strong>on</strong>sAllen, Richard G. 1 ; Huntingt<strong>on</strong>, Justin 2 ; Irmak, Ayse 3 ;deBruin, Henk 4 ; Kjaersgaard, Jeppe 51. Civil Engineering, University <strong>of</strong> Idaho, Kimberly, ID, USA2. Desert Research Institute, Reno, NV, USA3. School <strong>of</strong> Natural Resources, University <strong>of</strong> Nebraska,Lincoln, NE, USA4. Retired, Wageningen University, Wageningen,Ne<strong>the</strong>rlands5. Biological Engineering, South Dakota State University,Brookings, SD, USAMany satellites like MODIS and Landsat have returntimes <strong>of</strong> multiple days. Therefore, calculati<strong>on</strong> <strong>of</strong>evapotranspirati<strong>on</strong> (ET) over extended time periods requireswea<strong>the</strong>r data in between overpasses. NLDAS and NARRgridded wea<strong>the</strong>r data systems are produced by <strong>the</strong> WRFmodel or similar. These gridded sets represent ‘ambient’wea<strong>the</strong>r and surface energy balance under rainfallc<strong>on</strong>diti<strong>on</strong>s. The water balance is generally not informed <strong>on</strong>irrigati<strong>on</strong> and associated ET so that wea<strong>the</strong>r data generatedby <strong>the</strong>se models represent that occurring under rainfedc<strong>on</strong>diti<strong>on</strong>s. Local dryness tends to elevate near surfacetemperature (T) measurements by as much as 5 C, andreduces vapor pressure by up to <strong>on</strong>e-half, when compared tomeasurements made over an evaporating surface. When <strong>the</strong>data are entered into standardized reference ET equati<strong>on</strong>sfor estimating crop water requirements in irrigatedagriculture, <strong>the</strong> higher air temperatures and lower vaporpressures associated with <strong>the</strong> ambient c<strong>on</strong>diti<strong>on</strong>s tend tooverestimate ET anticipated in an irrigated envir<strong>on</strong>ment byup to 20%. A procedure is described for “c<strong>on</strong>diti<strong>on</strong>ing”ambient wea<strong>the</strong>r data from ‘arid’ envir<strong>on</strong>ments having lowvapor fluxes and high sensible heat fluxes so that datarepresent near surface air properties for <strong>the</strong> same climate,but over an evaporating, “reference” surface. Theseadjustments are necessary before applying ‘referenceevapotranspirati<strong>on</strong>’ methods such as <strong>the</strong> ASCE-EWRIPenman-M<strong>on</strong>teith equati<strong>on</strong> that assume equilibriumbetween <strong>the</strong> reference, evaporating surface and near surfaceair. Following c<strong>on</strong>diti<strong>on</strong>ing, <strong>the</strong> “equilibrium reference ET”can be scaled using crop coefficients or o<strong>the</strong>r parameters toestimate actual ET for a variety <strong>of</strong> vegetati<strong>on</strong>. Thec<strong>on</strong>diti<strong>on</strong>ing completes <strong>the</strong> feedback processes betweensurface evaporati<strong>on</strong> and near surface air properties. Theprocedure extrapolates T, vapor and wind speed pr<strong>of</strong>iles toand from a blended height <strong>of</strong> 50 m using ambient andreference vapor fluxes and sensible heat fluxes. T, humidity,solar radiati<strong>on</strong> and wind speed are utilized and <strong>the</strong>procedure can be applied to hourly or daily data. Theprocedure can be applied to measured wea<strong>the</strong>r data and togridded wea<strong>the</strong>r data from WRF-Noah and o<strong>the</strong>r landsimulati<strong>on</strong> models. The approach uses standard M-Osimilarity <strong>the</strong>ory. In applicati<strong>on</strong>s in sou<strong>the</strong>rn Idaho, <strong>the</strong>procedure estimated a 4 C decrease in 2 m T, doubling <strong>of</strong> 2m31
- Page 5 and 6: SCIENTIFIC PROGRAMSUNDAY, 19 FEBRUA
- Page 7 and 8: 1600h - 1900hMM-1MM-2MM-3MM-4MM-5MM
- Page 9 and 10: GM-7GM-8GM-9GM-10GM-11GM-12GM-13160
- Page 11 and 12: EM-25EM-26EM-27EM-28EM-29EM-301600h
- Page 13 and 14: SMM-8SMM-9SMM-10SMM-11SMM-12SMM-13S
- Page 15 and 16: SCM-24SCM-251600h - 1900hPM-1PM-2PM
- Page 17 and 18: 1030h - 1200h1030h - 1200h1030h - 1
- Page 19 and 20: ET-13ET-14ET-15ET-16ET-17ET-18ET-19
- Page 21 and 22: SWT-19SWT-201600h - 1900hSMT-1SMT-2
- Page 23 and 24: SCT-14SCT-15SCT-16SCT-17SCT-18SCT-1
- Page 25 and 26: MT-2MT-3MT-4MT-5MT-6MT-7MT-8MT-9MT-
- Page 27 and 28: 1330h - 1530h1530h - 1600h1600h - 1
- Page 29: esilience to hydrological hazards a
- Page 33 and 34: Montana and Oregon. Other applicati
- Page 35 and 36: accuracy of snow derivation from si
- Page 37 and 38: seasonal trends, and integrate clou
- Page 40 and 41: a single mission, the phrase “nea
- Page 42 and 43: climate and land surface unaccounte
- Page 44 and 45: esolution lidar-derived DEM was com
- Page 46 and 47: further verified that even for conv
- Page 48 and 49: underway and its utility can be ass
- Page 50 and 51: Courault, DominiqueAssessment of mo
- Page 52 and 53: used three Landsat-5 TM images (05/
- Page 55: storage change solutions in the for
- Page 59 and 60: Famiglietti, James S.Getting Real A
- Page 61 and 62: can be thought of as operating in t
- Page 63 and 64: mission and will address the follow
- Page 65 and 66: Gan, Thian Y.Soil Moisture Retrieva
- Page 67 and 68: match the two sets of estimates. Th
- Page 69 and 70: producing CGF snow cover products.
- Page 71 and 72: performance of the AWRA-L model for
- Page 73 and 74: oth local and regional hydrology. T
- Page 75 and 76: Euphorbia heterandena, and Echinops
- Page 77 and 78: the effectiveness of this calibrati
- Page 79 and 80: presents challenges to the validati
- Page 81 and 82:
long period time (1976-2010) was co
- Page 83 and 84:
has more improved resolution ( ) to
- Page 85 and 86:
in the flow over the floodplain ari
- Page 87 and 88:
fraction of the fresh water resourc
- Page 89 and 90:
to determine the source of the wate
- Page 91 and 92:
hydrologists, was initially assigne
- Page 93 and 94:
Sturm et al. (1995) introduced a se
- Page 95 and 96:
calendar day are then truncated and
- Page 97 and 98:
climate associated with hydrologica
- Page 99 and 100:
California Institute of Technology
- Page 101 and 102:
egion in Northern California that i
- Page 103 and 104:
Moller, DelwynTopographic Mapping o
- Page 105 and 106:
obtained from the Fifth Microwave W
- Page 107 and 108:
a constraint that is observed spati
- Page 109 and 110:
groundwater degradation, seawater i
- Page 111 and 112:
approach to estimate soil water con
- Page 113 and 114:
Norouzi, HamidrezaLand Surface Char
- Page 115 and 116:
Painter, Thomas H.The JPL Airborne
- Page 117 and 118:
Pavelsky, Tamlin M.Continuous River
- Page 119 and 120:
interferometric synthetic aperture
- Page 121 and 122:
elevant satellite missions, such as
- Page 123 and 124:
support decision-making related to
- Page 125 and 126:
oth the quantification of human wat
- Page 127 and 128:
parameter inversion of the time inv
- Page 129 and 130:
ground-based observational forcing
- Page 131 and 132:
Selkowitz, DavidExploring Landsat-d
- Page 133 and 134:
Shahroudi, NargesMicrowave Emissivi
- Page 135 and 136:
well as subsurface hydrological con
- Page 137 and 138:
Sturm, MatthewRemote Sensing and Gr
- Page 139 and 140:
Sutanudjaja, Edwin H.Using space-bo
- Page 141 and 142:
which can be monitored as an indica
- Page 143 and 144:
tools and methods to address one of
- Page 145 and 146:
Vanderjagt, Benjamin J.How sub-pixe
- Page 147 and 148:
Vila, Daniel A.Satellite Rainfall R
- Page 149 and 150:
and landuse sustainability. In this
- Page 151 and 152:
e very significant as seepage occur
- Page 153 and 154:
Wood, Eric F.Challenges in Developi
- Page 155 and 156:
Xie, PingpingGauge - Satellite Merg
- Page 157 and 158:
Yebra, MartaRemote sensing canopy c
- Page 159 and 160:
used. PIHM has ability to simulate


