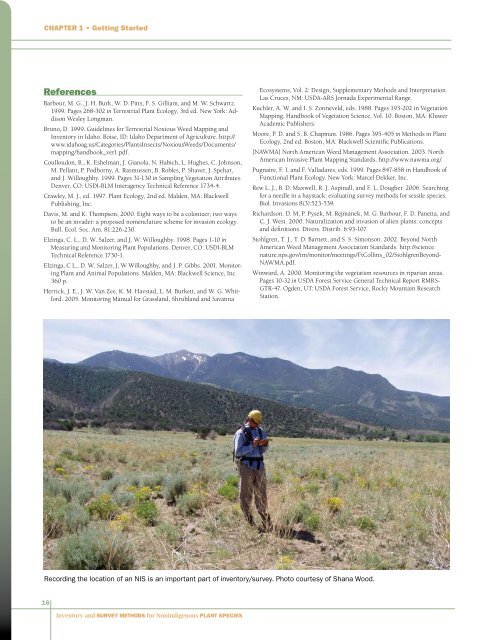
Chapter 1 • Getting StartedReferencesBarbour, M. G., J. H. Burk, W. D. Pitts, F. S. Gilliam, <strong>and</strong> M. W. Schwartz.1999. Pages 268-302 in Terrestrial <strong>Plant</strong> Ecology, 3rd ed. New York: AddisonWesley Longman.Bruno, D. 1999. Guidelines <strong>for</strong> Terrestrial Noxious Weed Mapping <strong>and</strong><strong>Inventory</strong> in Idaho. Boise, ID: Idaho Department of Agriculture. http://www.idahoag.us/Categories/<strong>Plant</strong>sInsects/NoxiousWeeds/Documents/mapping/h<strong>and</strong>book_ver1.pdf.Coulloudon, B., K. Eshelman, J. Gianola, N. Habich, L. Hughes, C. Johnson,M. Pellant, P. Podborny, A. Rasmussen, B. Robles, P. Shaver, J. Spehar,<strong>and</strong> J. Willoughby. 1999. Pages 31-130 in Sampling Vegetation Attributes.Denver, CO: USDI-BLM Interagency Technical Reference 1734-4.Crawley, M. J., ed. 1997. <strong>Plant</strong> Ecology, 2nd ed. Malden, MA: BlackwellPublishing, Inc.Davis, M. <strong>and</strong> K. Thompson, 2000. Eight ways to be a colonizer; two waysto be an invader: a proposed nomenclature scheme <strong>for</strong> invasion ecology.Bull. Ecol. Soc. Am. 81:226-230.Elzinga, C. L., D. W. Salzer, <strong>and</strong> J. W. Willoughby. 1998. Pages 1-10 inMeasuring <strong>and</strong> Monitoring <strong>Plant</strong> Populations. Denver, CO: USDI-BLMTechnical Reference 1730-1.Elzinga, C L., D. W. Salzer, J. W Willoughby, <strong>and</strong> J. P. Gibbs. 2001. Monitoring<strong>Plant</strong> <strong>and</strong> Animal Populations. Malden, MA: Blackwell Science, Inc.360 p.Herrick, J. E., J. W. Van Zee, K. M. Havstad, L. M. Burkett, <strong>and</strong> W. G. Whit<strong>for</strong>d.2005. Monitoring Manual <strong>for</strong> Grassl<strong>and</strong>, Shrubl<strong>and</strong> <strong>and</strong> SavannaEcosystems, Vol. 2: Design, Supplementary <strong>Methods</strong> <strong>and</strong> Interpretation.Las Cruces, NM: USDA-ARS Jornada Experimental Range.Kuchler, A. W. <strong>and</strong> I. S. Zonneveld, eds. 1988. Pages 193-202 in VegetationMapping, H<strong>and</strong>book of Vegetation Science, Vol. 10. Boston, MA: KluwerAcademic Publishers.Moore, P. D. <strong>and</strong> S. B. Chapman. 1986. Pages 395-405 in <strong>Methods</strong> in <strong>Plant</strong>Ecology, 2nd ed. Boston, MA: Blackwell Scientific Publications.[NAWMA] North American Weed Management Association. 2003. NorthAmerican Invasive <strong>Plant</strong> Mapping St<strong>and</strong>ards. http://www.nawma.org/.Pugnaire, F. I. <strong>and</strong> F. Valladares, eds. 1999. Pages 847-858 in H<strong>and</strong>book ofFunctional <strong>Plant</strong> Ecology. New York: Marcel Dekker, Inc.Rew L. J., B. D. Maxwell, R. J. Aspinall, <strong>and</strong> F. L. Dougher. 2006. Searching<strong>for</strong> a needle in a haystack: evaluating survey methods <strong>for</strong> sessile species.Biol. Invasions 8(3):523-539.Richardson. D. M, P. Pysek, M. Rejmánek, M. G. Barbour, F. D. Panetta, <strong>and</strong>C. J. West. 2000. Naturalization <strong>and</strong> invasion of alien plants: concepts<strong>and</strong> definitions. Divers. Distrib. 6:93-107.Stohlgren, T. J., T. D. Barnett, <strong>and</strong> S. S. Simonson. 2002. Beyond NorthAmerican Weed Management Association St<strong>and</strong>ards. http://science.nature.nps.gov/im/monitor/meetings/FtCollins_02/StohlgrenBeyond-NAWMA.pdf.Winward, A. 2000. Monitoring the vegetation resources in riparian areas.Pages 10-32 in USDA Forest Service General Technical Report RMRS-GTR-47. Ogden, UT: USDA Forest Service, Rocky Mountain ResearchStation.Recording the location of an NIS is an important part of inventory/survey. Photo courtesy of Shana Wood.16<strong>Inventory</strong> <strong>and</strong> <strong>Survey</strong> <strong>Methods</strong> <strong>for</strong> <strong>Nonindigenous</strong> <strong>Plant</strong> <strong>Species</strong>
Chapter 2Data ManagementM<strong>and</strong>y TuIntroductionInvasive nonindigenous plant species are one of thebiggest threats to the successful management ofour natural resources. Not only do nonindigenousspecies (NIS) negatively impact our native species,communities, <strong>and</strong> ecosystems, but keeping track ofNIS data can be challenging as well. In many instancesNIS invasions can be reversed, halted, or slowed, <strong>and</strong>in certain situations, even badly infested areas canbe restored to healthy systems dominated by nativespecies (Chornesky <strong>and</strong> R<strong>and</strong>all 2003). In order todocument such successes <strong>and</strong> failures, inventory/surveydata are initially required to assess the currentcondition, followed by monitoring data to documentchanges over time. Good record keeping of the location,extent, <strong>and</strong> abundance of NIS, <strong>and</strong> the impactsof those NIS, management actions, <strong>and</strong> restorationef<strong>for</strong>ts is essential <strong>for</strong> efficient NIS management. Inaddition, tracking the success or failure of such ef<strong>for</strong>tscan be used adaptively to improve the effectiveness offuture management approaches.Why Manage <strong>Nonindigenous</strong><strong>Plant</strong> <strong>Species</strong> Data?Natural resource managers need to know where the NIS ofinterest are in their management area. This can be achievedwith one of the inventory/survey methods described inthis book. However, once NIS inventory or survey data arecollected, they must be managed if they are to fulfill anypurpose. The most effective way to manage inventory/surveydata is in digital <strong>for</strong>mat on a computer. A digital copy canbe more easily kept current <strong>and</strong> shared with others thanpaper copies. Digital data management enables managers toimmediately find all past NIS individuals/patches that havebeen mapped <strong>and</strong> treated <strong>and</strong> ensures that data will not belost as a result of personnel changes.<strong>Inventory</strong>/survey data must address the l<strong>and</strong> managementgoals. Generally these data will include knowledge of thedistribution <strong>and</strong> the degree of infestation (cover, density,etc.) of NIS populations (inventory/survey data) or theirspread (monitoring data). Evaluation of such data allowmanagers to allocate time <strong>and</strong> other resources in the moststrategic <strong>and</strong> effective way, <strong>and</strong> this is more easily done withdigital rather than paper versions of the data. Additionally,if data are not recorded <strong>and</strong> organized in an easily decipherable<strong>for</strong>mat, site knowledge may be lost. With all NISinventory/survey <strong>and</strong> monitoring data in one easily accessible<strong>and</strong> translatable <strong>for</strong>mat, managers can get a “snapshot”picture of the current NIS situation <strong>and</strong> potential dispersalpathways/vectors <strong>and</strong> determine changes in populations.Equipped with these data, managers can:• Strategically spend resources to get the most work done atthe lowest cost• Develop strategies focused on prevention <strong>and</strong> earlydetection/rapid response, rather than control <strong>and</strong>containment only• Share data at multiple scales with other partners• Predict potential NIS problems <strong>and</strong> likely sites of invasion• Generate awareness of NIS issues with the public• Attract fundingThe three examples provided below demonstrate thatwhen inventory/survey data are collected <strong>and</strong> maintained ina digital <strong>for</strong>mat, it can be easily accessed <strong>and</strong> immediatelyused in a variety of applications to help meet NIS managementobjectives.Snapshot of the Distribution <strong>and</strong> Abundance of NISA one-time survey or inventory <strong>for</strong> NIS can produce a mapof the distribution <strong>and</strong> abundance of NIS populations in thesampled areas. Some inventory/survey methods also allowpredictive maps to be made (see Chapter 6) showing wheretarget NIS might be found over an entire area of interest, <strong>and</strong>where future inventories/surveys should be conducted.Figure 1 shows an example “snapshot” from the SanPablo Bay National Wildlife Refuge in Cali<strong>for</strong>nia, in whichthe distribution <strong>and</strong> abundance of only one NIS, perennialpepperweed (Lepidium latifolium), has been mapped (shownin red). A few things are immediately apparent. There areseveral small <strong>and</strong> large infestations, the infestations appearto start right at the edge of the impoundments/levees, <strong>and</strong>some of the large infestations have several smaller outliers.From this map, in which only the distribution of perennialpepperweed is shown, <strong>and</strong> the value of certain parcels ofproperty or the presence of rare <strong>and</strong> endangered speciesis not designated, a management strategy <strong>for</strong> perennialpepperweed can still be developed. The small outlierpopulations will be controlled first, while the larger populationsare kept in check to prevent spread, <strong>and</strong> the potentialpathways <strong>and</strong> vectors of perennial pepperweed invasion aredeciphered. For example, does the invasion appear to spreadalong the impoundment roads, which could be related tothe movement of equipment, or does the species appear tobe spread by water, which would restrict it to waterwaysor flood-prone areas? Identifying possible vectors <strong>and</strong>/orpathways of dispersal is key to preventing new invasions. Itis equally important to identify uninfested areas, since it ismuch easier to implement an early detection/rapid responseprogram than to control well-established NIS.17<strong>Inventory</strong> <strong>and</strong> <strong>Survey</strong> <strong>Methods</strong> <strong>for</strong> <strong>Nonindigenous</strong> <strong>Plant</strong> <strong>Species</strong>