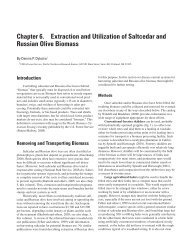
Chapter 6 • Stratified R<strong>and</strong>om Sampling Methoda wide range of environments. Such an approach increasesthe accuracy of future monitoring <strong>and</strong> impact studies thatlead to prioritization <strong>for</strong> management.Prior knowledge may include a list of the NIS identifiedin the management area <strong>and</strong> region, previously observedpatches in the area, <strong>and</strong> scientific literature on the biology<strong>and</strong> distribution of the target species. Prior knowledgetells us that most NIS are introduced via human activity,so source areas of NIS can be assumed to be associatedwith areas of such activity. Thus, roads, power lines, <strong>and</strong>other areas of human-mediated disturbances will serve assource areas in most habitats. NIS occurrence can generallybe expected to decline with increased distance from thesesources into areas of little or no human activity. There<strong>for</strong>e,we could use these areas to stratify our sampling.First principles relate to the ecological processes thatinteract to determine where any particular NIS is located.For example, a first principle of plant dispersal is that therewill be more propagules (seeds or vegetative units) near thesource, <strong>and</strong> the propagules will decline along a gradientwith increased distance from the source. Other first principlesrelate to species-specific habitat requirements. Annualcolonizing species usually require recently disturbed soilswith a lack of competitors. Because many colonizing NISrequire higher light intensities than native species <strong>and</strong> thuscannot tolerate extensive shade from a <strong>for</strong>est canopy, theywill invade only meadows <strong>and</strong> grassl<strong>and</strong>s, or areas wherethe <strong>for</strong>est canopy has been removed. Other species may bemoisture limited <strong>and</strong> thus are more likely to be found inriparian plant communities. Again, we would expect NISabundance to decline with distance from roads <strong>and</strong> trails ifthey are the source, but we may also expect certain habitatsor environments to influence NIS abundance.ObjectivesIn large l<strong>and</strong>scapes (more than 50,000 acres or 20,200ha), where inventorying the entire area will not be possiblebecause of time <strong>and</strong> funding constraints, a survey methodsuch as stratified r<strong>and</strong>om sampling can help prioritize areasby environments that are apt to influence the growth of theNIS. We use a stratified r<strong>and</strong>om survey method because itis useful <strong>for</strong> prioritizing sample locations, <strong>and</strong> the resultingdata can be used to predict where NIS infestations maybe located <strong>and</strong> which habitats may be more susceptible toNIS invasion. By using first principles, stratified r<strong>and</strong>omsampling increases the probability of finding locations<strong>for</strong> any given NIS in the areas perceived to contain NIS,while still collecting data away from those “known” keyareas. However, knowing where a species is not locatedis as important as knowing where it is located. Only within<strong>for</strong>mation on both presence <strong>and</strong> absence can we predictwhere a species is likely to be found <strong>and</strong> improve ourmanagement strategies.Using our knowledge <strong>and</strong> first principles we have chosenroads <strong>and</strong> trails as our feature to stratify on <strong>and</strong> sample awayfrom when conducting NIS surveys in parts of the GreaterYellowstone Ecosystem. Other factors such as habitats or firehistory could also be used, provided sampling was per<strong>for</strong>medin the area known to contain the species, <strong>and</strong> also ina location away from that area. There are different <strong>for</strong>ms ofstratified r<strong>and</strong>om sampling; Hirzel <strong>and</strong> Guisan (2002) <strong>and</strong>Maggini et al. (2002) provide good overviews.The method is called stratified r<strong>and</strong>om because thesampling selects a factor or feature to stratify on—roads<strong>and</strong> trails in this example—but the actual locations of thesamples along or within these areas are r<strong>and</strong>omly selected.We are also using transects because they are more time <strong>and</strong>cost efficient than sampling points r<strong>and</strong>omly or on a grid(Rew et al. 2006).<strong>Methods</strong>: Steps to Conducting a StratifiedR<strong>and</strong>om <strong>Nonindigenous</strong> <strong>Plant</strong> <strong>Survey</strong>Presample to Identify the Stratification Feature <strong>and</strong>General Sampling ProcedureThe presample is typically based on two assumptions:(1) nonindigenous plant species occurrence will decreasewith distance from human activity, <strong>and</strong> (2) plants of aparticular NIS will be more frequent in some plant communitiesthan others (e.g., grass-, <strong>for</strong>b-, <strong>and</strong> shrub-dominatedcommunities, rather than <strong>for</strong>ested communities). Thepresample is established to verify these two assumptions.There<strong>for</strong>e, an essential part of the presample is that dataare plotted <strong>and</strong> analyzed. This is true of any data collection.There is no point collecting data on a regular basis unlessthey are analyzed to ensure the data collected are answeringthe intended questions—if not, then some adjustments needto be made to the sampling protocol. Checking data partwaythrough a season is a step that many people avoid, with theun<strong>for</strong>tunate result that filing cabinets <strong>and</strong> computer harddrives are full of unusable data.Even if changes are made to the sampling protocolafter the presample data analysis, the data can usually beincorporated into the main sample data. So, it is not as if thepresampling stage is a waste of time <strong>and</strong> energy.To conduct the presample, establish r<strong>and</strong>omly locatedtransects on <strong>and</strong> perpendicular to the chosen stratificationfactor—in our example, roads <strong>and</strong> trails (Figure 1). As atransect is traversed, data on NIS presence, length <strong>and</strong> widthof patch, <strong>and</strong> major vegetation changes <strong>and</strong> disturbances arerecorded using a GPS. We use a 10-m-wide transect becausewe predetermined this distance as the maximum distance50<strong>Inventory</strong> <strong>and</strong> <strong>Survey</strong> <strong>Methods</strong> <strong>for</strong> <strong>Nonindigenous</strong> <strong>Plant</strong> <strong>Species</strong>
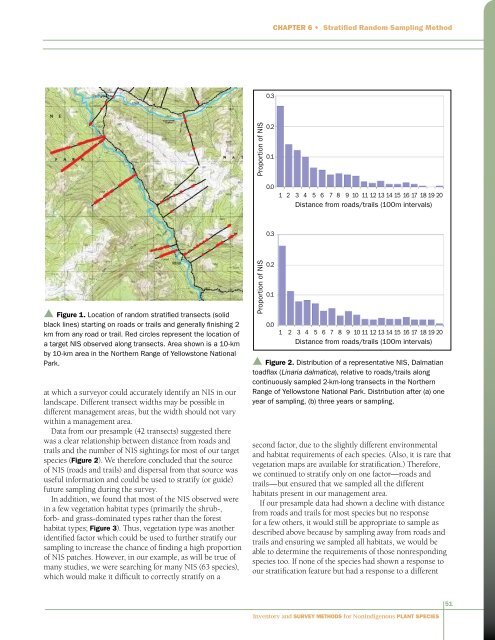
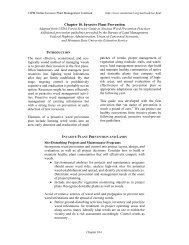
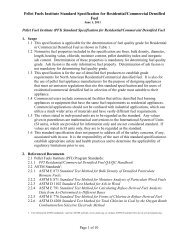
Chapter 6 • Stratified R<strong>and</strong>om Sampling Method0.3Proportion of NIS0.20.10.01 2 3 4 5 6 7 8 9 10 11 12 13 14 15 16 17 18 19 20Distance from roads/trails (100m intervals)0.3▲ Figure 1. Location of r<strong>and</strong>om stratified transects (solidblack lines) starting on roads or trails <strong>and</strong> generally finishing 2km from any road or trail. Red circles represent the location ofa target NIS observed along transects. Area shown is a 10-kmby 10-km area in the Northern Range of Yellowstone NationalPark.at which a surveyor could accurately identify an NIS in ourl<strong>and</strong>scape. Different transect widths may be possible indifferent management areas, but the width should not varywithin a management area.Data from our presample (42 transects) suggested therewas a clear relationship between distance from roads <strong>and</strong>trails <strong>and</strong> the number of NIS sightings <strong>for</strong> most of our targetspecies (Figure 2). We there<strong>for</strong>e concluded that the sourceof NIS (roads <strong>and</strong> trails) <strong>and</strong> dispersal from that source wasuseful in<strong>for</strong>mation <strong>and</strong> could be used to stratify (or guide)future sampling during the survey.In addition, we found that most of the NIS observed werein a few vegetation habitat types (primarily the shrub-,<strong>for</strong>b- <strong>and</strong> grass-dominated types rather than the <strong>for</strong>esthabitat types; Figure 3). Thus, vegetation type was anotheridentified factor which could be used to further stratify oursampling to increase the chance of finding a high proportionof NIS patches. However, in our example, as will be true ofmany studies, we were searching <strong>for</strong> many NIS (63 species),which would make it difficult to correctly stratify on aProportion of NIS0.20.10.01 2 3 4 5 6 7 8 9 10 11 12 13 14 15 16 17 18 19 20Distance from roads/trails (100m intervals)▲ Figure 2. Distribution of a representative NIS, Dalmatiantoadflax (Linaria dalmatica), relative to roads/trails alongcontinuously sampled 2-km-long transects in the NorthernRange of Yellowstone National Park. Distribution after (a) oneyear of sampling, (b) three years or sampling.second factor, due to the slightly different environmental<strong>and</strong> habitat requirements of each species. (Also, it is rare thatvegetation maps are available <strong>for</strong> stratification.) There<strong>for</strong>e,we continued to stratify only on one factor—roads <strong>and</strong>trails—but ensured that we sampled all the differenthabitats present in our management area.If our presample data had shown a decline with distancefrom roads <strong>and</strong> trails <strong>for</strong> most species but no response<strong>for</strong> a few others, it would still be appropriate to sample asdescribed above because by sampling away from roads <strong>and</strong>trails <strong>and</strong> ensuring we sampled all habitats, we would beable to determine the requirements of those nonrespondingspecies too. If none of the species had shown a response toour stratification feature but had a response to a different51<strong>Inventory</strong> <strong>and</strong> <strong>Survey</strong> <strong>Methods</strong> <strong>for</strong> <strong>Nonindigenous</strong> <strong>Plant</strong> <strong>Species</strong>