L<strong>and</strong>scape-Scale Wildl<strong>and</strong>Inventories/<strong>Survey</strong>s: Utah State University <strong>Methods</strong>Chapter 3Steven A. Dewey <strong>and</strong> Kimberly A. AndersenIntroductionInventories <strong>and</strong> surveys of nonindigenous plantspecies (NIS) in wildl<strong>and</strong>s are conducted by Utah StateUniversity (USU) primarily <strong>for</strong> generating distributionmaps that will then be used in support of improvedmanagement, strategic planning, <strong>and</strong> control ef<strong>for</strong>ts.Mapping is used here in its broadest sense to covera range of observational <strong>and</strong> data-recording activities,conducted both singly <strong>and</strong> over time, <strong>and</strong> over a broadrange of l<strong>and</strong>scape scales. It there<strong>for</strong>e encompassesinventory <strong>and</strong> survey, as defined in Chapter 1.Inventories/surveys are essential elements of the earlydetection <strong>and</strong> rapid response strategy being promotedtoday in most wildl<strong>and</strong> NIS management plans. A rotatingschedule could be developed to search a portion ofthe l<strong>and</strong> each year, so that within a specified number ofyears the majority of the management unit could be inspected.Inventories or surveys of high-likelihood areasmight need to be per<strong>for</strong>med annually, whereas systematicinventories/surveys of the most remote sites orhabitats deemed least suitable <strong>for</strong> NIS establishmentor spread might be per<strong>for</strong>med only once every five toten years. The goal is to schedule inventories/surveysoften enough to detect all new populations be<strong>for</strong>e theyexceed a size considered feasible <strong>for</strong> eradication. Earlydetection of NIS through regular inventories/surveysis just as essential to successful NIS managementas the early detection of wildfires is to effective firemanagement.The first step in any NIS mapping project is toestablish a clear set of objectives (see Chapter 1).The critical questions that must be answered be<strong>for</strong>eany field work begins include “what is the primarypurpose of the project?” <strong>and</strong> “how will the data beused?” Factors to consider in setting objectives includethe size of the area to be mapped <strong>and</strong> overall cost.The types of data that could be collected during fieldinventories/surveys are nearly limitless, as are thenumber of possible methods. Costs can range from afew cents to many dollars per acre. It is our observationthat without first establishing clear objectives,the tendency of many project planners is to collect farmore in<strong>for</strong>mation than will be needed, thus reducingthe number of acres that can be mapped <strong>and</strong> loweringoverall project efficiency.USU Objectives <strong>and</strong> <strong>Methods</strong>USU field crews have conducted numerous plant inventories/surveys,ranging from exploratory to extensive innature, on tens of thous<strong>and</strong>s of acres of western wildl<strong>and</strong>sin support of NIS management programs <strong>for</strong> the Bureau ofL<strong>and</strong> Management, Forest Service, National Park Service,<strong>and</strong> Utah Division of Wildlife Resources. The primaryobjective of these projects has been to find <strong>and</strong> map infestationsof newly established NIS plants <strong>and</strong> populations tosupport early detection <strong>and</strong> rapid response ef<strong>for</strong>ts by l<strong>and</strong>managers. Infestations of other targeted species have usuallybeen mapped too, but generally not at an equally high levelof detail or resolution. The overarching goal has been tosearch as many acres as possible within time <strong>and</strong> budgetconstraints, while still maintaining an acceptably high levelof detection confidence.TerminologySome of the terms used in this chapter have been createdby the authors to describe methods <strong>and</strong> st<strong>and</strong>ards developedby USU <strong>for</strong> conducting NIS inventories/surveys on wildl<strong>and</strong>s(Dewey <strong>and</strong> Andersen 2005a,b,c). Terms unique tothis chapter are defined as follows:Search Target (ST): Refers to plant species that are the objectof a field search. ST descriptions must always includespecies, growth stage, <strong>and</strong> Minimum Detection Target Size(MDTS).Minimum Detection Target Size (MDTS): The smallestpopulation size (single plant or patch) of the least visibletargeted species that observers are confident of detecting<strong>and</strong> identifying, at a stated level of probability, under actualfield conditions using their stated protocols. In most of ourprojects the MDTS was set at 0.01 acre.Effective Detection Swath Width (EDSW): The maximumwidth of a linear search pattern (a b<strong>and</strong> transect) in whicha walking observer is confident of visually detecting atleast 90% of all targeted species’ populations of the statedminimum target size. EDSW must be adjusted accordingto factors influencing target visibility, such as species, stageof growth, topography, <strong>and</strong> associated vegetative cover, inorder to maintain the 90% minimum detection st<strong>and</strong>ard.Data dictionary choices <strong>for</strong> effective detection swath widthsin most projects were 25, 50, 100, 150, 200, 250, <strong>and</strong> 300yards. (See inset box on next page <strong>for</strong> metric equivalents.)Patch Separation Resolution (PSR): The minimum distanceused to distinguish between different populations (singleor multiple plants) of target species. Populations separatedby the PSR distance or more must be recorded as separatepatches. <strong>Plant</strong>s separated by less than the stated PSR are22<strong>Inventory</strong> <strong>and</strong> <strong>Survey</strong> <strong>Methods</strong> <strong>for</strong> <strong>Nonindigenous</strong> <strong>Plant</strong> <strong>Species</strong>
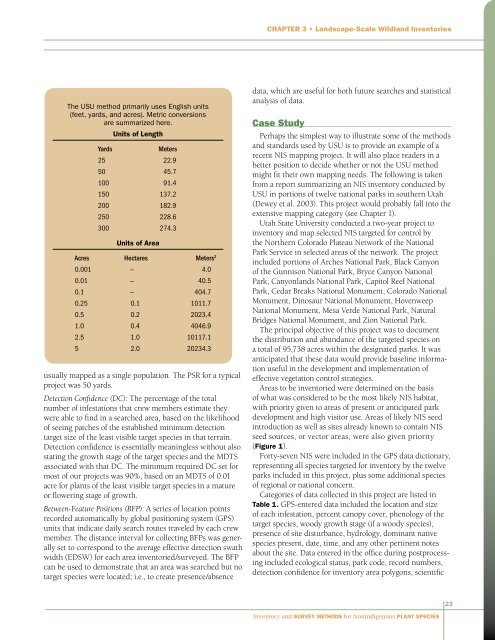
Chapter 3 • L<strong>and</strong>scape-Scale Wildl<strong>and</strong> InventoriesThe USU method primarily uses English units(feet, yards, <strong>and</strong> acres). Metric conversionsare summarized here.YardsUnits of LengthMeters25 22.950 45.7100 91.4150 137.2200 182.9250 228.6300 274.3Units of AreaAcres Hectares Meters 20.001 — 4.00.01 — 40.50.1 — 404.70.25 0.1 1011.70.5 0.2 2023.41.0 0.4 4046.92.5 1.0 10117.15 2.0 20234.3usually mapped as a single population. The PSR <strong>for</strong> a typicalproject was 50 yards.Detection Confidence (DC): The percentage of the totalnumber of infestations that crew members estimate theywere able to find in a searched area, based on the likelihoodof seeing patches of the established minimum detectiontarget size of the least visible target species in that terrain.Detection confidence is essentially meaningless without alsostating the growth stage of the target species <strong>and</strong> the MDTSassociated with that DC. The minimum required DC set <strong>for</strong>most of our projects was 90%, based on an MDTS of 0.01acre <strong>for</strong> plants of the least visible target species in a matureor flowering stage of growth.Between-Feature Positions (BFP): A series of location pointsrecorded automatically by global positioning system (GPS)units that indicate daily search routes traveled by each crewmember. The distance interval <strong>for</strong> collecting BFPs was generallyset to correspond to the average effective detection swathwidth (EDSW) <strong>for</strong> each area inventoried/surveyed. The BFPcan be used to demonstrate that an area was searched but notarget species were located; i.e., to create presence/absencedata, which are useful <strong>for</strong> both future searches <strong>and</strong> statisticalanalysis of data.Case StudyPerhaps the simplest way to illustrate some of the methods<strong>and</strong> st<strong>and</strong>ards used by USU is to provide an example of arecent NIS mapping project. It will also place readers in abetter position to decide whether or not the USU methodmight fit their own mapping needs. The following is takenfrom a report summarizing an NIS inventory conducted byUSU in portions of twelve national parks in southern Utah(Dewey et al. 2003). This project would probably fall into theextensive mapping category (see Chapter 1).Utah State University conducted a two-year project toinventory <strong>and</strong> map selected NIS targeted <strong>for</strong> control bythe Northern Colorado Plateau Network of the NationalPark Service in selected areas of the network. The projectincluded portions of Arches National Park, Black Canyonof the Gunnison National Park, Bryce Canyon NationalPark, Canyonl<strong>and</strong>s National Park, Capitol Reef NationalPark, Cedar Breaks National Monument, Colorado NationalMonument, Dinosaur National Monument, HovenweepNational Monument, Mesa Verde National Park, NaturalBridges National Monument, <strong>and</strong> Zion National Park.The principal objective of this project was to documentthe distribution <strong>and</strong> abundance of the targeted species ona total of 95,738 acres within the designated parks. It wasanticipated that these data would provide baseline in<strong>for</strong>mationuseful in the development <strong>and</strong> implementation ofeffective vegetation control strategies.Areas to be inventoried were determined on the basisof what was considered to be the most likely NIS habitat,with priority given to areas of present or anticipated parkdevelopment <strong>and</strong> high visitor use. Areas of likely NIS seedintroduction as well as sites already known to contain NISseed sources, or vector areas, were also given priority(Figure 1).Forty-seven NIS were included in the GPS data dictionary,representing all species targeted <strong>for</strong> inventory by the twelveparks included in this project, plus some additional speciesof regional or national concern.Categories of data collected in this project are listed inTable 1. GPS-entered data included the location <strong>and</strong> sizeof each infestation, percent canopy cover, phenology of thetarget species, woody growth stage (if a woody species),presence of site disturbance, hydrology, dominant nativespecies present, date, time, <strong>and</strong> any other pertinent notesabout the site. Data entered in the office during postprocessingincluded ecological status, park code, record numbers,detection confidence <strong>for</strong> inventory area polygons, scientific23<strong>Inventory</strong> <strong>and</strong> <strong>Survey</strong> <strong>Methods</strong> <strong>for</strong> <strong>Nonindigenous</strong> <strong>Plant</strong> <strong>Species</strong>