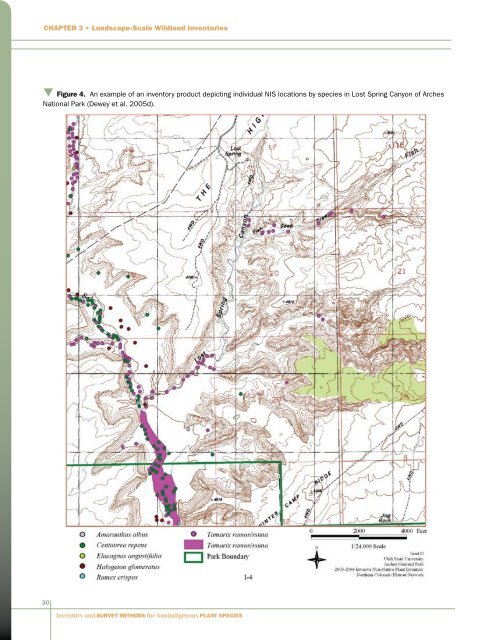
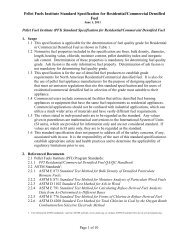
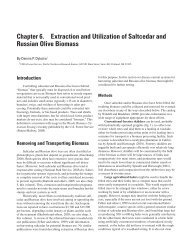
Chapter 3 • L<strong>and</strong>scape-Scale Wildl<strong>and</strong> Inventoriesq Figure 4. An example of an inventory product depicting individual NIS locations by species in Lost Spring Canyon of ArchesNational Park (Dewey et al. 2005d).30<strong>Inventory</strong> <strong>and</strong> <strong>Survey</strong> <strong>Methods</strong> <strong>for</strong> <strong>Nonindigenous</strong> <strong>Plant</strong> <strong>Species</strong>
Chapter 3 • L<strong>and</strong>scape-Scale Wildl<strong>and</strong> Inventories<strong>Nonindigenous</strong> plant species infestations up to 1 acrewere typically recorded as point features. Crew memberswere given the option to record infestations between 1 <strong>and</strong> 5acres as points, polygons (actual areas or gross areas), or linefeatures, depending on which feature they felt would bestrepresent the situation. However, in this project essentially allpopulations within the 1- to 5-acre size range were recordedas point features. The few patches in this size range that wererecorded as polygon or line features were later converted inthe office to point features in order to facilitate viewing ongeographic in<strong>for</strong>mation system (GIS)-generated maps.Crews mapped larger infestations (more than 5 acres) oftarget species either as actual field polygons (by walkingthe patch perimeter with the GPS), or by collecting GPS“generic points” in the field at key locations along theboundary of the infestation <strong>and</strong> then using those pointslater to digitize the infestation polygon on the computer inthe office (Figure 4). Generic points were deleted after suchpolygons were drawn, <strong>and</strong> were not included in the finalreport. This type of mapping was used exclusively <strong>for</strong> largeinfestations of salt cedar found in some inventory areas.The size of each population recorded as a point featurewas estimated visually (using a laser rangefinder) <strong>and</strong> placedin the size category most closely matching its actual area:(1) one to few plants, 0.001 acre, (2) 0.01 acre, (3) 0.1 acre,(4) 0.25 acre, (5) 0.5 acre, (6) 1.0 acre, (7) 2.5 acres, or (8)5.0 acres. Canopy cover of each population was estimatedvisually <strong>and</strong> placed in one of five categories: (1) trace = lessthan 1%, (2) low = 1 to 5% , (3) moderate = 6 to 25%, (4)high = 26 to 50%, or (5) majority = 51 to 100%. As a generalrule, individuals or clusters of NIS plants of the same speciesseparated by less than 50 yards (PSR) were considered asingle infestation/patch <strong>and</strong> were mapped as a single feature(point, line, or polygon). <strong>Plant</strong>s or groups of plants separatedby more than 50 yards were mapped as separate infestations/patches(refer to definition of PSR).Equipment NeededTo collect field data, USU mapping crews used TrimbleGPS units (GeoExplorer III, Geo XM, or Geo XT; TrimbleNavigation Ltd.), chosen because of their capacity to have aprogrammed data dictionary to ensure all relevant data arecollected in the field. All location data were differentiallycorrected with postprocessing software. Other GPS unitsmay be suitable, but noncorrected data reduce the accuracyof the work <strong>and</strong> make returning to specific locations moredifficult, especially in variable terrain. GPS data files weredownloaded each night <strong>and</strong> reviewed on a laptop computerusing Trimble’s Pathfinder Office GIS software program.Other GIS software programs, such as ArcView or ArcMap(ESRI Inc.), are available to process data collected by otherGPS units. Other basic field equipment included a laserrangefinder, compass, clinometer, binoculars, two-way radio,field maps, <strong>and</strong> field pack.Although GPS units were used in all USU projects, theywould not be required to apply the fundamental techniques<strong>and</strong> st<strong>and</strong>ards described by this inventory method. Evenprojects limited to recording NIS distribution data byh<strong>and</strong> on paper field maps could incorporate most of thesemethods.Advantages <strong>and</strong> Disadvantages of theUSU <strong>Inventory</strong> MethodThis method is designed <strong>for</strong> l<strong>and</strong>scape-scale NIS mappingprojects in which hundreds or thous<strong>and</strong>s of acres must besearched by ground crews in a relatively short time, but itcan also be effectively used in small l<strong>and</strong>scapes (up to 100acres). The objective in most USU inventory projects is tolocate <strong>and</strong> map the distribution <strong>and</strong> relative abundance ofinfestations of targeted species with a high level of detectionconfidence. Searches are conducted in such a way that crewmembers can be confident of finding 90 to 100% of alloccurrences of a minimum specified infestation size in thearea inventoried. Typically the minimum specified infestationsize is 0.01 acre.For inventories/surveys to be meaningful, what is beinginventoried/surveyed must be clearly defined. In otherwords, it has to be stated <strong>and</strong> documented exactly what isbeing searched <strong>for</strong>. In our case, we are searching <strong>for</strong> infestations/patchesof specified NIS of a minimum declared patchsize <strong>and</strong> larger. We consider our approach to be a type ofqualified inventory/census rather than a survey/poll becausethe goal is to account <strong>for</strong> all NIS patches of the specified sizecategories within the defined l<strong>and</strong> area. With our technique,we do not claim to be doing an inventory/census of everyindividual plant or of patches less than the MDTS. We alsodo not inventory within patches; that is, we do not know orcare how many individual plants make up a patch. We onlyneed to know patch size <strong>and</strong> the relative abundance (canopycover estimate) of NIS plants making up each patch in orderto meet our objectives. We plan <strong>and</strong> adjust our samplingdesign so we are confident of finding essentially all targetspecies patches of the minimum stated size (<strong>and</strong> larger)within the inventory area. Obviously, a search resolutionthat is barely fine enough to inventory all 0.01-acre patcheson a 1,000-acre block of l<strong>and</strong> would not be fine enoughto inventory all individual plants. We do find <strong>and</strong> map anumber of individual target NIS plants <strong>and</strong> patches smallerthan the MDTS, but not enough to be considered an inventoryof these smaller infestation sizes.<strong>Nonindigenous</strong> plant species occurrences are mapped aspoints, which means that the USU method can be consider-31<strong>Inventory</strong> <strong>and</strong> <strong>Survey</strong> <strong>Methods</strong> <strong>for</strong> <strong>Nonindigenous</strong> <strong>Plant</strong> <strong>Species</strong>