Inventory and Survey Methods for Nonindigenous Plant Species (PDF)
Inventory and Survey Methods for Nonindigenous Plant Species (PDF)
Inventory and Survey Methods for Nonindigenous Plant Species (PDF)
- No tags were found...

You also want an ePaper? Increase the reach of your titles
YUMPU automatically turns print PDFs into web optimized ePapers that Google loves.
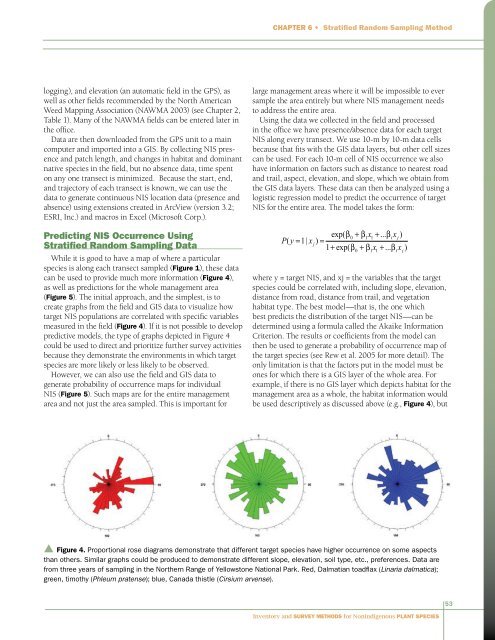
Chapter 6 • Stratified R<strong>and</strong>om Sampling Methodlogging), <strong>and</strong> elevation (an automatic field in the GPS), aswell as other fields recommended by the North AmericanWeed Mapping Association (NAWMA 2003) (see Chapter 2,Table 1). Many of the NAWMA fields can be entered later inthe office.Data are then downloaded from the GPS unit to a maincomputer <strong>and</strong> imported into a GIS. By collecting NIS presence<strong>and</strong> patch length, <strong>and</strong> changes in habitat <strong>and</strong> dominantnative species in the field, but no absence data, time spenton any one transect is minimized. Because the start, end,<strong>and</strong> trajectory of each transect is known, we can use thedata to generate continuous NIS location data (presence <strong>and</strong>absence) using extensions created in ArcView (version 3.2;ESRI, Inc.) <strong>and</strong> macros in Excel (Microsoft Corp.).Predicting NIS Occurrence UsingStratified R<strong>and</strong>om Sampling DataWhile it is good to have a map of where a particularspecies is along each transect sampled (Figure 1), these datacan be used to provide much more in<strong>for</strong>mation (Figure 4),as well as predictions <strong>for</strong> the whole management area(Figure 5). The initial approach, <strong>and</strong> the simplest, is tocreate graphs from the field <strong>and</strong> GIS data to visualize howtarget NIS populations are correlated with specific variablesmeasured in the field (Figure 4). If it is not possible to developpredictive models, the type of graphs depicted in Figure 4could be used to direct <strong>and</strong> prioritize further survey activitiesbecause they demonstrate the environments in which targetspecies are more likely or less likely to be observed.However, we can also use the field <strong>and</strong> GIS data togenerate probability of occurrence maps <strong>for</strong> individualNIS (Figure 5). Such maps are <strong>for</strong> the entire managementarea <strong>and</strong> not just the area sampled. This is important <strong>for</strong>large management areas where it will be impossible to eversample the area entirely but where NIS management needsto address the entire area.Using the data we collected in the field <strong>and</strong> processedin the office we have presence/absence data <strong>for</strong> each targetNIS along every transect. We use 10-m by 10-m data cellsbecause that fits with the GIS data layers, but other cell sizescan be used. For each 10-m cell of NIS occurrence we alsohave in<strong>for</strong>mation on factors such as distance to nearest road<strong>and</strong> trail, aspect, elevation, <strong>and</strong> slope, which we obtain fromthe GIS data layers. These data can then be analyzed using alogistic regression model to predict the occurrence of targetNIS <strong>for</strong> the entire area. The model takes the <strong>for</strong>m:where y = target NIS, <strong>and</strong> xj = the variables that the targetspecies could be correlated with, including slope, elevation,distance from road, distance from trail, <strong>and</strong> vegetationhabitat type. The best model—that is, the one whichbest predicts the distribution of the target NIS—can bedetermined using a <strong>for</strong>mula called the Akaike In<strong>for</strong>mationCriterion. The results or coefficients from the model canthen be used to generate a probability of occurrence map ofthe target species (see Rew et al. 2005 <strong>for</strong> more detail). Theonly limitation is that the factors put in the model must beones <strong>for</strong> which there is a GIS layer of the whole area. Forexample, if there is no GIS layer which depicts habitat <strong>for</strong> themanagement area as a whole, the habitat in<strong>for</strong>mation wouldbe used descriptively as discussed above (e.g., Figure 4), but▲ Figure 4. Proportional rose diagrams demonstrate that different target species have higher occurrence on some aspectsthan others. Similar graphs could be produced to demonstrate different slope, elevation, soil type, etc., preferences. Data arefrom three years of sampling in the Northern Range of Yellowstone National Park. Red, Dalmatian toadflax (Linaria dalmatica);green, timothy (Phleum pratense); blue, Canada thistle (Cirsium arvense).53<strong>Inventory</strong> <strong>and</strong> <strong>Survey</strong> <strong>Methods</strong> <strong>for</strong> <strong>Nonindigenous</strong> <strong>Plant</strong> <strong>Species</strong>