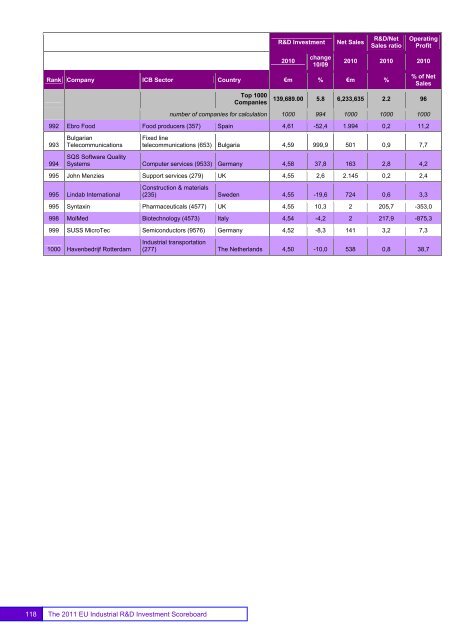
R&D <strong>Investment</strong>2010change10/09Net SalesR&D/NetSales ratioOperatingProfit2010 2010 2010Rank Company ICB Sector Country €m % €m %Top 1000Companies% of NetSales139,689.00 5.8 6,233,635 2.2 96number of companies for calculation 1000 994 1000 1000 1000992 Ebro Food Food producers (357) Spain 4,61 -52,4 1.994 0,2 11,2993994BulgarianTelecommunicationsFixed linetelecommunications (653) Bulgaria 4,59 999,9 501 0,9 7,7SQS Software QualitySystems Computer services (9533) Germany 4,58 37,8 163 2,8 4,2995 John Menzies Support services (279) UK 4,55 2,6 2.145 0,2 2,4995 Lindab InternationalConstruction & materials(235) Sweden 4,55 -19,6 724 0,6 3,3995 Syntaxin Pharmaceuticals (4577) UK 4,55 10,3 2 205,7 -353,0998 MolMed Biotechnology (4573) Italy 4,54 -4,2 2 217,9 -875,3999 SUSS MicroTec Semiconductors (9576) Germany 4,52 -8,3 141 3,2 7,31000 Havenbedrijf Rotterdam<strong>Industrial</strong> transportation(277) The Netherlands 4,50 -10,0 538 0,8 38,7118The <strong>2011</strong> <strong>EU</strong> <strong>Industrial</strong> R&D <strong>Investment</strong> Scoreboard
5.2 Ranking of the top 1000 non-<strong>EU</strong> companies by level of R&D investmentR&D <strong>Investment</strong>Net SalesR&D/NetSales ratioOperatingProfit2010change10/092010 2010 2010Rank Company ICB Sector Country €m % €m %Top 1000Companies% of NetSales323,928.73 3.2 8,675,068 3.7 10.7number of companies for calculation1000 996 1000 1000 9981 Roche Pharmaceuticals (4577) Switzerland 7.181,11 -4,5 37.967 18,9 28,42 Pfizer Pharmaceuticals (4577) USA 7.016,61 21,4 50.546 13,9 15,63 Microsoft Software (9537) USA 6.740,81 3,8 52.137 12,9 38,84 Toyota Motor Automobiles & parts (335) Japan 6.666,69 -19,8 174.180 3,8 1,25 Merck US Pharmaceuticals (4577) USA 6.403,88 47,0 34.280 18,7 5,46 Samsung ElectronicsElectronic equipment(2737) South Korea 6.181,36 24,9 101.566 6,1 12,67 Novartis Pharmaceuticals (4577) Switzerland 6.022,97 10,9 37.736 16,0 22,48 General Motors Automobiles & parts (335) USA 5.189,60 14,7 101.073 5,1 4,89 Johnson & Johnson Pharmaceuticals (4577) USA 5.101,64 -2,0 45.908 11,1 28,110 Intel Semiconductors (9576) USA 4.901,87 16,3 32.517 15,1 36,111 Panasonic Leisure goods (374) Japan 4.383,25 -7,9 68.179 6,4 -0,312 Honda Motor Automobiles & parts (335) Japan 4.258,72 -17,7 78.852 5,4 4,913 Sony Leisure goods (374) Japan 3.970,55 -13,1 66.304 6,0 0,514 Cisco SystemsTelecommunicationsequipment (9578) USA 3.930,59 1,2 29.847 13,2 23,115 IBM Computer services (9533) USA 3.788,21 2,8 74.445 5,1 20,116 Ford Motor Automobiles & parts (335) USA 3.727,09 2,0 96.125 3,9 10,717 Eli Lilly Pharmaceuticals (4577) USA 3.640,77 12,9 17.201 21,2 28,918 Nissan Motor Automobiles & parts (335) Japan 3.542,75 -15,4 69.092 5,1 2,319 HitachiComputer hardware(9572) Japan 3.423,40 -10,6 82.431 4,2 1,020 Oracle Software (9537) USA 3.368,54 38,9 26.553 12,7 33,821 Toshiba General industrials (272) Japan 2.970,99 -14,5 58.654 5,1 1,022 General Electric General industrials (272) USA 2.936,20 18,5 110.923 2,6 20,323 Canon24 BoeingElectronic officeequipment (9574) Japan 2.902,70 3,7 34.070 8,5 10,4Aerospace & defence(271) USA 2.807,24 8,5 47.935 5,9 7,825 Google Internet (9535) USA 2.804,26 32,3 21.856 12,8 35,426 Abbott Laboratories Pharmaceuticals (4577) USA 2.776,25 35,7 26.214 10,6 17,527 Takeda Pharmaceutical Pharmaceuticals (4577) Japan 2.724,16 -34,6 13.474 20,2 28,028 Bristol-Myers Squibb Pharmaceuticals (4577) USA 2.658,16 -2,2 14.524 18,3 31,529 NTTFixed linetelecommunications (653) Japan 2.556,44 3,7 93.578 2,7 11,330 NEC Computer services (9533) Japan 2.536,46 -20,4 32.933 7,7 1,331 Denso Automobiles & parts (335) Japan 2.482,30 -9,1 27.359 9,1 4,832 Hewlett-PackardComputer hardware(9572) USA 2.205,69 5,0 93.722 2,4 9,1119The <strong>2011</strong> <strong>EU</strong> <strong>Industrial</strong> R&D <strong>Investment</strong> Scoreboard 119