EU Industrial R&D Investment Scoreboards 2011
EU Industrial R&D Investment Scoreboards 2011
EU Industrial R&D Investment Scoreboards 2011
You also want an ePaper? Increase the reach of your titles
YUMPU automatically turns print PDFs into web optimized ePapers that Google loves.
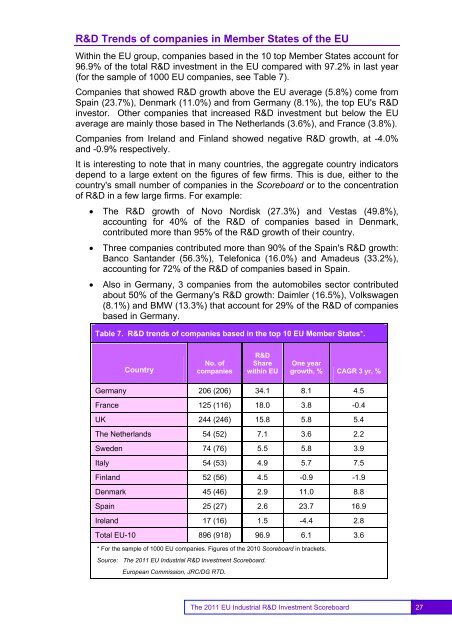
R&D Trends of companies in Member States of the <strong>EU</strong>Within the <strong>EU</strong> group, companies based in the 10 top Member States account for96.9% of the total R&D investment in the <strong>EU</strong> compared with 97.2% in last year(for the sample of 1000 <strong>EU</strong> companies, see Table 7).Companies that showed R&D growth above the <strong>EU</strong> average (5.8%) come fromSpain (23.7%), Denmark (11.0%) and from Germany (8.1%), the top <strong>EU</strong>'s R&Dinvestor. Other companies that increased R&D investment but below the <strong>EU</strong>average are mainly those based in The Netherlands (3.6%), and France (3.8%).Companies from Ireland and Finland showed negative R&D growth, at -4.0%and -0.9% respectively.It is interesting to note that in many countries, the aggregate country indicatorsdepend to a large extent on the figures of few firms. This is due, either to thecountry's small number of companies in the Scoreboard or to the concentrationof R&D in a few large firms. For example:• The R&D growth of Novo Nordisk (27.3%) and Vestas (49.8%),accounting for 40% of the R&D of companies based in Denmark,contributed more than 95% of the R&D growth of their country.• Three companies contributed more than 90% of the Spain's R&D growth:Banco Santander (56.3%), Telefonica (16.0%) and Amadeus (33.2%),accounting for 72% of the R&D of companies based in Spain.• Also in Germany, 3 companies from the automobiles sector contributedabout 50% of the Germany's R&D growth: Daimler (16.5%), Volkswagen(8.1%) and BMW (13.3%) that account for 29% of the R&D of companiesbased in Germany.Table 7. R&D trends of companies based in the top 10 <strong>EU</strong> Member States*.CountryNo. ofcompaniesR&DSharewithin <strong>EU</strong>One yeargrowth, % CAGR 3 yr, %Germany 206 (206) 34.1 8.1 4.5France 125 (116) 18.0 3.8 -0.4UK 244 (246) 15.8 5.8 5.4The Netherlands 54 (52) 7.1 3.6 2.2Sweden 74 (76) 5.5 5.8 3.9Italy 54 (53) 4.9 5.7 7.5Finland 52 (56) 4.5 -0.9 -1.9Denmark 45 (46) 2.9 11.0 8.8Spain 25 (27) 2.6 23.7 16.9Ireland 17 (16) 1.5 -4.4 2.8Total <strong>EU</strong>-10 896 (918) 96.9 6.1 3.6* For the sample of 1000 <strong>EU</strong> companies. Figures of the 2010 Scoreboard in brackets.Source: The <strong>2011</strong> <strong>EU</strong> <strong>Industrial</strong> R&D <strong>Investment</strong> Scoreboard.European Commission, JRC/DG RTD.27The <strong>2011</strong> <strong>EU</strong> <strong>Industrial</strong> R&D <strong>Investment</strong> Scoreboard 27


