

EU Industrial R&D Investment Scoreboards 2011
EU Industrial R&D Investment Scoreboards 2011
EU Industrial R&D Investment Scoreboards 2011

You also want an ePaper? Increase the reach of your titles
YUMPU automatically turns print PDFs into web optimized ePapers that Google loves.
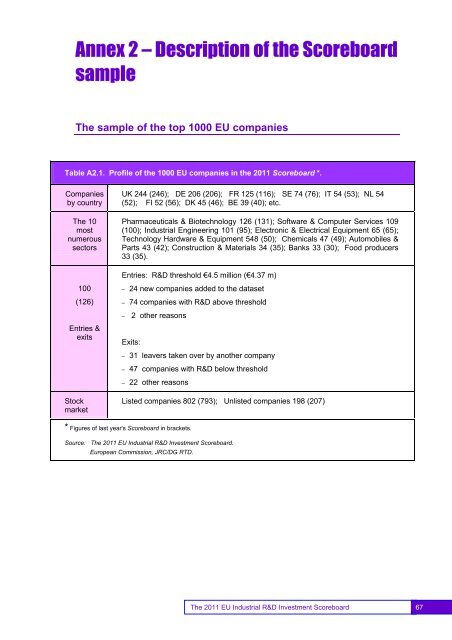
Annex 2 – Description of the <strong>Scoreboards</strong>ampleThe sample of the top 1000 <strong>EU</strong> companiesTable A2.1. Profile of the 1000 <strong>EU</strong> companies in the <strong>2011</strong> Scoreboard *.Companiesby countryThe 10mostnumeroussectorsUK 244 (246); DE 206 (206); FR 125 (116); SE 74 (76); IT 54 (53); NL 54(52); FI 52 (56); DK 45 (46); BE 39 (40); etc.Pharmaceuticals & Biotechnology 126 (131); Software & Computer Services 109(100); <strong>Industrial</strong> Engineering 101 (95); Electronic & Electrical Equipment 65 (65);Technology Hardware & Equipment 548 (50); Chemicals 47 (49); Automobiles &Parts 43 (42); Construction & Materials 34 (35); Banks 33 (30); Food producers33 (35).Entries: R&D threshold €4.5 million (€4.37 m)100(126)Entries &exits– 24 new companies added to the dataset– 74 companies with R&D above threshold– 2 other reasonsExits:– 31 leavers taken over by another company– 47 companies with R&D below threshold– 22 other reasonsStockmarketListed companies 802 (793); Unlisted companies 198 (207)* Figures of last year's Scoreboard in brackets.Source: The <strong>2011</strong> <strong>EU</strong> <strong>Industrial</strong> R&D <strong>Investment</strong> Scoreboard.European Commission, JRC/DG RTD.67The <strong>2011</strong> <strong>EU</strong> <strong>Industrial</strong> R&D <strong>Investment</strong> Scoreboard 67


