EU Industrial R&D Investment Scoreboards 2011
EU Industrial R&D Investment Scoreboards 2011
EU Industrial R&D Investment Scoreboards 2011
Create successful ePaper yourself
Turn your PDF publications into a flip-book with our unique Google optimized e-Paper software.
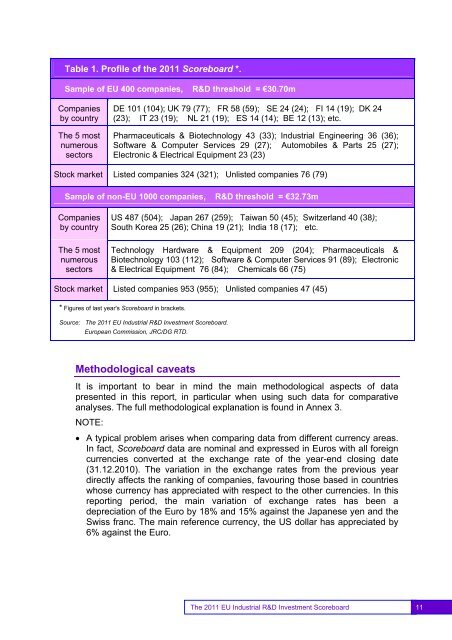
Table 1. Profile of the <strong>2011</strong> Scoreboard *.Sample of <strong>EU</strong> 400 companies,R&D threshold = €30.70mCompaniesby countryThe 5 mostnumeroussectorsDE 101 (104); UK 79 (77); FR 58 (59); SE 24 (24); FI 14 (19); DK 24(23); IT 23 (19); NL 21 (19); ES 14 (14); BE 12 (13); etc.Pharmaceuticals & Biotechnology 43 (33); <strong>Industrial</strong> Engineering 36 (36);Software & Computer Services 29 (27); Automobiles & Parts 25 (27);Electronic & Electrical Equipment 23 (23)Stock market Listed companies 324 (321); Unlisted companies 76 (79)Sample of non-<strong>EU</strong> 1000 companies,R&D threshold = €32.73mCompaniesby countryThe 5 mostnumeroussectorsUS 487 (504); Japan 267 (259); Taiwan 50 (45); Switzerland 40 (38);South Korea 25 (26); China 19 (21); India 18 (17); etc.Technology Hardware & Equipment 209 (204); Pharmaceuticals &Biotechnology 103 (112); Software & Computer Services 91 (89); Electronic& Electrical Equipment 76 (84); Chemicals 66 (75)Stock market Listed companies 953 (955); Unlisted companies 47 (45)* Figures of last year's Scoreboard in brackets.Source: The <strong>2011</strong> <strong>EU</strong> <strong>Industrial</strong> R&D <strong>Investment</strong> Scoreboard.European Commission, JRC/DG RTD.Methodological caveatsIt is important to bear in mind the main methodological aspects of datapresented in this report, in particular when using such data for comparativeanalyses. The full methodological explanation is found in Annex 3.NOTE:• A typical problem arises when comparing data from different currency areas.In fact, Scoreboard data are nominal and expressed in Euros with all foreigncurrencies converted at the exchange rate of the year-end closing date(31.12.2010). The variation in the exchange rates from the previous yeardirectly affects the ranking of companies, favouring those based in countrieswhose currency has appreciated with respect to the other currencies. In thisreporting period, the main variation of exchange rates has been adepreciation of the Euro by 18% and 15% against the Japanese yen and theSwiss franc. The main reference currency, the US dollar has appreciated by6% against the Euro.11The <strong>2011</strong> <strong>EU</strong> <strong>Industrial</strong> R&D <strong>Investment</strong> Scoreboard 11


