

EU Industrial R&D Investment Scoreboards 2011
EU Industrial R&D Investment Scoreboards 2011
EU Industrial R&D Investment Scoreboards 2011

Create successful ePaper yourself
Turn your PDF publications into a flip-book with our unique Google optimized e-Paper software.
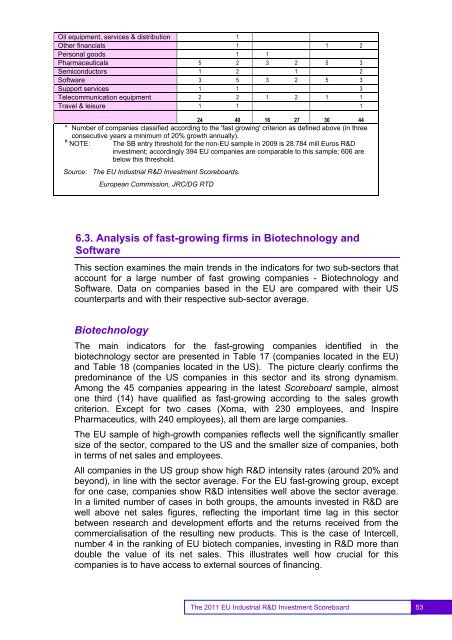
Oil equipment, services & distribution 1Other financials 1 1 2Personal goods 1 1Pharmaceuticals 5 2 3 2 5 3Semiconductors 1 2 1 2Software 3 5 3 2 5 3Support services 1 1 3Telecommunication equipment 2 2 1 2 1 1Travel & leisure 1 1 124 40 16 27 30 44* Number of companies classified according to the 'fast growing' criterion as defined above (in threeconsecutive years a minimum of 20% growth annually).# NOTE: The SB entry threshold for the non-<strong>EU</strong> sample in 2009 is 28.784 mill Euros R&Dinvestment; accordingly 394 <strong>EU</strong> companies are comparable to this sample; 606 arebelow this threshold.Source: The <strong>EU</strong> <strong>Industrial</strong> R&D <strong>Investment</strong> <strong>Scoreboards</strong>.European Commission, JRC/DG RTD6.3. Analysis of fast-growing firms in Biotechnology andSoftwareThis section examines the main trends in the indicators for two sub-sectors thataccount for a large number of fast growing companies - Biotechnology andSoftware. Data on companies based in the <strong>EU</strong> are compared with their UScounterparts and with their respective sub-sector average.BiotechnologyThe main indicators for the fast-growing companies identified in thebiotechnology sector are presented in Table 17 (companies located in the <strong>EU</strong>)and Table 18 (companies located in the US). The picture clearly confirms thepredominance of the US companies in this sector and its strong dynamism.Among the 45 companies appearing in the latest Scoreboard sample, almostone third (14) have qualified as fast-growing according to the sales growthcriterion. Except for two cases (Xoma, with 230 employees, and InspirePharmaceutics, with 240 employees), all them are large companies.The <strong>EU</strong> sample of high-growth companies reflects well the significantly smallersize of the sector, compared to the US and the smaller size of companies, bothin terms of net sales and employees.All companies in the US group show high R&D intensity rates (around 20% andbeyond), in line with the sector average. For the <strong>EU</strong> fast-growing group, exceptfor one case, companies show R&D intensities well above the sector average.In a limited number of cases in both groups, the amounts invested in R&D arewell above net sales figures, reflecting the important time lag in this sectorbetween research and development efforts and the returns received from thecommercialisation of the resulting new products. This is the case of Intercell,number 4 in the ranking of <strong>EU</strong> biotech companies, investing in R&D more thandouble the value of its net sales. This illustrates well how crucial for thiscompanies is to have access to external sources of financing.53The <strong>2011</strong> <strong>EU</strong> <strong>Industrial</strong> R&D <strong>Investment</strong> Scoreboard 53


