

EU Industrial R&D Investment Scoreboards 2011
EU Industrial R&D Investment Scoreboards 2011
EU Industrial R&D Investment Scoreboards 2011

You also want an ePaper? Increase the reach of your titles
YUMPU automatically turns print PDFs into web optimized ePapers that Google loves.
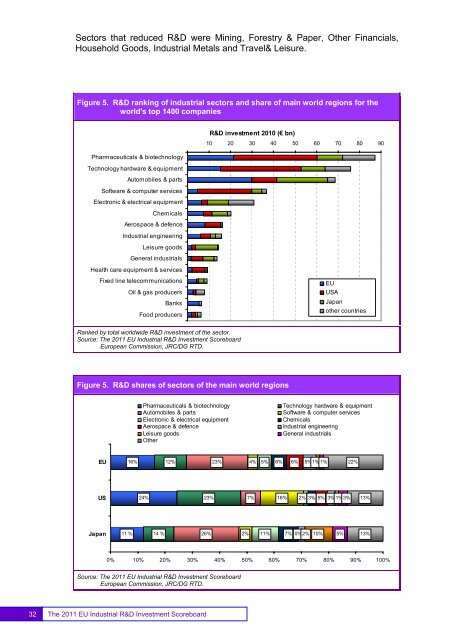
Sectors that reduced R&D were Mining, Forestry & Paper, Other Financials,Household Goods, <strong>Industrial</strong> Metals and Travel& Leisure.Figure 5. R&D ranking of industrial sectors and share of main world regions for theworld's top 1400 companiesPharmaceuticals & biotechnologyR&D investment 2010 (€ bn)10 20 30 40 50 60 70 80 90Technology hardware & equipmentAutomobiles & partsSoftware & computer servicesElectronic & electrical equipmentChemicalsAerospace & defence<strong>Industrial</strong> engineeringLeisure goodsGeneral industrialsHealth care equipment & servicesFixed line telecommunicationsOil & gas producersBanksFood producers<strong>EU</strong>USAJapanother countriesRanked by total worldwide R&D investment of the sector.Source: The <strong>2011</strong> <strong>EU</strong> <strong>Industrial</strong> R&D <strong>Investment</strong> ScoreboardEuropean Commission, JRC/DG RTD.Figure 5. R&D shares of sectors of the main world regionsPharmaceuticals & biotechnologyAutomobiles & partsElectronic & electrical equipmentAerospace & defenceLeisure goodsOtherTechnology hardware & equipmentSoftware & computer servicesChemicals<strong>Industrial</strong> engineeringGeneral industrials<strong>EU</strong>16%12%23%4%5%6%6%5% 1% 1%22%US24%23%7%16%2% 3% 5% 3% 1% 3%13%Japan11 % 14 % 26% 2%11%7% 0% 2%10%5% 13%0% 10% 20% 30% 40% 50% 60% 70% 80% 90% 100%Source: The <strong>2011</strong> <strong>EU</strong> <strong>Industrial</strong> R&D <strong>Investment</strong> ScoreboardEuropean Commission, JRC/DG RTD.32The <strong>2011</strong> <strong>EU</strong> <strong>Industrial</strong> R&D <strong>Investment</strong> Scoreboard


