

EU Industrial R&D Investment Scoreboards 2011
EU Industrial R&D Investment Scoreboards 2011
EU Industrial R&D Investment Scoreboards 2011

You also want an ePaper? Increase the reach of your titles
YUMPU automatically turns print PDFs into web optimized ePapers that Google loves.
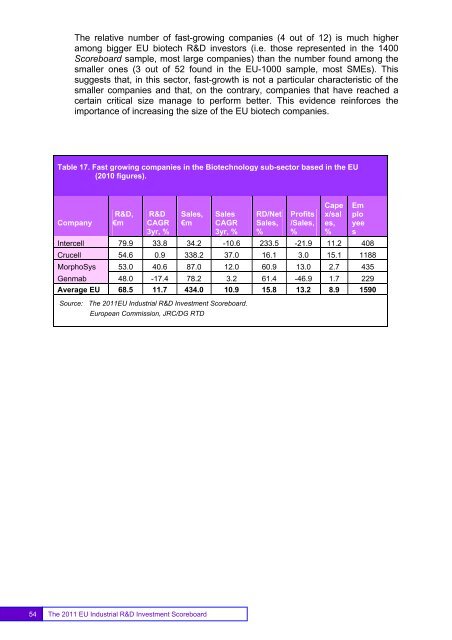
The relative number of fast-growing companies (4 out of 12) is much higheramong bigger <strong>EU</strong> biotech R&D investors (i.e. those represented in the 1400Scoreboard sample, most large companies) than the number found among thesmaller ones (3 out of 52 found in the <strong>EU</strong>-1000 sample, most SMEs). Thissuggests that, in this sector, fast-growth is not a particular characteristic of thesmaller companies and that, on the contrary, companies that have reached acertain critical size manage to perform better. This evidence reinforces theimportance of increasing the size of the <strong>EU</strong> biotech companies.Table 17. Fast growing companies in the Biotechnology sub-sector based in the <strong>EU</strong>(2010 figures).CompanyR&D,€mR&DCAGR3yr, %Sales,€mSalesCAGR3yr, %RD/NetSales,%Profits/Sales,%Capex/sales,%Intercell 79.9 33.8 34.2 -10.6 233.5 -21.9 11.2 408Crucell 54.6 0.9 338.2 37.0 16.1 3.0 15.1 1188MorphoSys 53.0 40.6 87.0 12.0 60.9 13.0 2.7 435Genmab 48.0 -17.4 78.2 3.2 61.4 -46.9 1.7 229Average <strong>EU</strong> 68.5 11.7 434.0 10.9 15.8 13.2 8.9 1590Source: The <strong>2011</strong><strong>EU</strong> <strong>Industrial</strong> R&D <strong>Investment</strong> Scoreboard.European Commission, JRC/DG RTDEmployees54The <strong>2011</strong> <strong>EU</strong> <strong>Industrial</strong> R&D <strong>Investment</strong> Scoreboard


