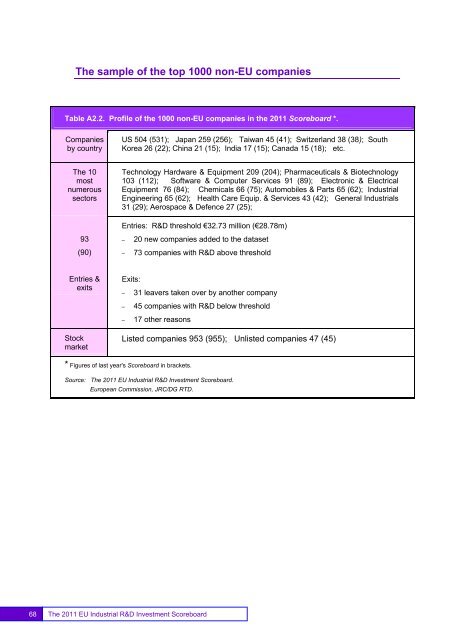
The sample of the top 1000 non-<strong>EU</strong> companiesTable A2.2. Profile of the 1000 non-<strong>EU</strong> companies in the <strong>2011</strong> Scoreboard *.Companiesby countryUS 504 (531); Japan 259 (256); Taiwan 45 (41); Switzerland 38 (38); SouthKorea 26 (22); China 21 (15); India 17 (15); Canada 15 (18); etc.The 10mostnumeroussectors93(90)Technology Hardware & Equipment 209 (204); Pharmaceuticals & Biotechnology103 (112); Software & Computer Services 91 (89); Electronic & ElectricalEquipment 76 (84); Chemicals 66 (75); Automobiles & Parts 65 (62); <strong>Industrial</strong>Engineering 65 (62); Health Care Equip. & Services 43 (42); General <strong>Industrial</strong>s31 (29); Aerospace & Defence 27 (25);Entries: R&D threshold €32.73 million (€28.78m)– 20 new companies added to the dataset– 73 companies with R&D above thresholdEntries &exitsStockmarketExits:– 31 leavers taken over by another company– 45 companies with R&D below threshold– 17 other reasonsListed companies 953 (955); Unlisted companies 47 (45)* Figures of last year's Scoreboard in brackets.Source: The <strong>2011</strong> <strong>EU</strong> <strong>Industrial</strong> R&D <strong>Investment</strong> Scoreboard.European Commission, JRC/DG RTD.68The <strong>2011</strong> <strong>EU</strong> <strong>Industrial</strong> R&D <strong>Investment</strong> Scoreboard
Mergers and acquisitions involving Scoreboard companies• Square Enix, Japan acquired Eidos, UK. Square Enix didn’t disclose anyR&D in its annual report and accounts.• Kraft Foods, USA acquired Cadbury, UK. Kraft Foods discloses R&D and isranked 143 in the non-<strong>EU</strong> sample.• Clipper Wind Power, UK was acquired by United Technologies, USA. UnitedTechnologies discloses R&D and is ranked 54 in the non-<strong>EU</strong> group.• Reckitt Benkiser, UK acquired SSL International, UK. Reckitt Benkiserdiscloses R&D and is ranked 142 in the <strong>EU</strong> group.• Honeywell, USA acquired Sperian Protection, France. Honeywell disclosesR&D and is ranked 62 in the non-<strong>EU</strong> group.• BTG, UK acquired Biocompatibles International, UK. BTG discloses R&Dand is ranked 358 in the <strong>EU</strong> group.• FLIR Systems, USA acquired Raymarine, UK. FLIR Systems discloses R&Dand is ranked 502 in the non-<strong>EU</strong> group.• Mitsubishi Rayon, Japan acquired Lucite International, UK. Mitsubishi Rayondiscloses R&D and is ranked 350 in the non-<strong>EU</strong> group.• Shire, UK acquired Movetis, The Netherlands. Shire discloses R&D and isranked 54 in the <strong>EU</strong> group.• Travis Perkins, UK acquired the BSS Group, UK. Travis Perkins didn’tdisclose any R&D in its annual report and accounts.• Emerson Electric, USA acquired Chloride Group, UK. Emerson Electricdiscloses R&D and is ranked 169 in the non-<strong>EU</strong> group.• Proximagen, UK acquired Minster Pharmaceuticals, UK. Proximagendiscloses R&D and is ranked 835 in the <strong>EU</strong> group.• Unicom Systems, USA acquired Macro 4, UK. Unicom Systems did notprovide annual reports and accounts before the cut-off date.• Pfizer, USA acquired Thiakis, UK. Pfizer discloses R&D and is ranked 2 inthe non-<strong>EU</strong> group.• Deltek, USA acquired Maconomy, Denmark. Deltek discloses R&D and isranked 889 in the non-<strong>EU</strong> group.• TDK, Japan acquired EPCOS, Germany. TDK discloses R&D and is ranked122 in the non-<strong>EU</strong> group.• SSI <strong>Investment</strong>s II, Ireland acquired SkillSoft, Ireland. SSI <strong>Investment</strong>s IIdiscloses R&D and is ranked 366 in the <strong>EU</strong> group.• Deutsche Post, Germany acquired Deutsche Postbank, Germany. DeutschePost discloses R&D and is ranked 188 in the <strong>EU</strong> group.• Canon, Japan acquired Oce, The Netherlands. Canon discloses R&D and isranked 23 in the non-<strong>EU</strong> group.69The <strong>2011</strong> <strong>EU</strong> <strong>Industrial</strong> R&D <strong>Investment</strong> Scoreboard 69