

EU Industrial R&D Investment Scoreboards 2011
EU Industrial R&D Investment Scoreboards 2011
EU Industrial R&D Investment Scoreboards 2011

You also want an ePaper? Increase the reach of your titles
YUMPU automatically turns print PDFs into web optimized ePapers that Google loves.
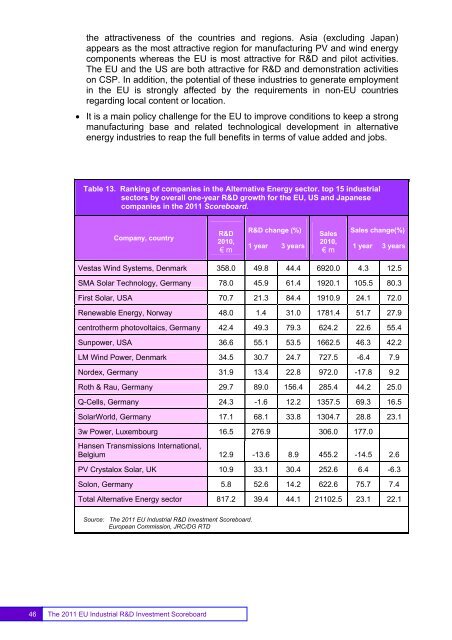
the attractiveness of the countries and regions. Asia (excluding Japan)appears as the most attractive region for manufacturing PV and wind energycomponents whereas the <strong>EU</strong> is most attractive for R&D and pilot activities.The <strong>EU</strong> and the US are both attractive for R&D and demonstration activitieson CSP. In addition, the potential of these industries to generate employmentin the <strong>EU</strong> is strongly affected by the requirements in non-<strong>EU</strong> countriesregarding local content or location.• It is a main policy challenge for the <strong>EU</strong> to improve conditions to keep a strongmanufacturing base and related technological development in alternativeenergy industries to reap the full benefits in terms of value added and jobs.Table 13. Ranking of companies in the Alternative Energy sector. top 15 industrialsectors by overall one-year R&D growth for the <strong>EU</strong>, US and Japanesecompanies in the <strong>2011</strong> Scoreboard.Company, countryR&D2010,€ mR&D change (%)1 year 3 yearsSales2010,€ mSales change(%)1 year 3 yearsVestas Wind Systems, Denmark 358.0 49.8 44.4 6920.0 4.3 12.5SMA Solar Technology, Germany 78.0 45.9 61.4 1920.1 105.5 80.3First Solar, USA 70.7 21.3 84.4 1910.9 24.1 72.0Renewable Energy, Norway 48.0 1.4 31.0 1781.4 51.7 27.9centrotherm photovoltaics, Germany 42.4 49.3 79.3 624.2 22.6 55.4Sunpower, USA 36.6 55.1 53.5 1662.5 46.3 42.2LM Wind Power, Denmark 34.5 30.7 24.7 727.5 -6.4 7.9Nordex, Germany 31.9 13.4 22.8 972.0 -17.8 9.2Roth & Rau, Germany 29.7 89.0 156.4 285.4 44.2 25.0Q-Cells, Germany 24.3 -1.6 12.2 1357.5 69.3 16.5SolarWorld, Germany 17.1 68.1 33.8 1304.7 28.8 23.13w Power, Luxembourg 16.5 276.9 306.0 177.0Hansen Transmissions International,Belgium 12.9 -13.6 8.9 455.2 -14.5 2.6PV Crystalox Solar, UK 10.9 33.1 30.4 252.6 6.4 -6.3Solon, Germany 5.8 52.6 14.2 622.6 75.7 7.4Total Alternative Energy sector 817.2 39.4 44.1 21102.5 23.1 22.1Source: The <strong>2011</strong> <strong>EU</strong> <strong>Industrial</strong> R&D <strong>Investment</strong> Scoreboard.European Commission, JRC/DG RTD46The <strong>2011</strong> <strong>EU</strong> <strong>Industrial</strong> R&D <strong>Investment</strong> Scoreboard


