- Page 6 and 7: Figure S1. One-year R&D investment,
- Page 8: The specialisation of EU companies
- Page 11 and 12: A high number of the companies in t
- Page 13 and 14: 1. IntroductionThe 2011 "EU Industr
- Page 15 and 16: Table 1. Profile of the 2011 Scoreb
- Page 17 and 18: 2. OverviewIn the last year compani
- Page 19 and 20: Survey on R&D investment by the EU
- Page 21 and 22: 3. Top R&D investing companiesThis
- Page 23 and 24: R&D changes driven by Mergers and A
- Page 25 and 26: Dynamics of top R&D companiesEvery
- Page 27 and 28: 4. R&D distribution by regionThis c
- Page 29 and 30: Figure 3.R&D investment by the top
- Page 31 and 32: R&D Trends of companies in Member S
- Page 33 and 34: 5. R&D distribution by industrialse
- Page 35 and 36: The actual contribution of an indus
- Page 37 and 38: Table 8. Ranking of top 15 industri
- Page 39 and 40: Those based in the US specialise in
- Page 41 and 42: Figure 7. Annual growth rates of ma
- Page 43 and 44: Table 10.Ranking of industrial sect
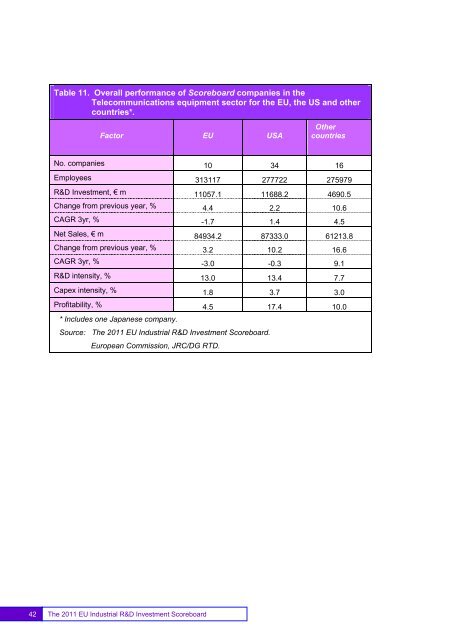
- Page 45: The profitability of US companies (
- Page 49 and 50: Alternative energyAs observed in pr
- Page 51 and 52: 6. Fast growing companiesThis chapt
- Page 53 and 54: The list of the companies showing t
- Page 55 and 56: Table 15. Companies classified as f
- Page 57 and 58: Oil equipment, services & distribut
- Page 59 and 60: Table 18. Fast growing companies in
- Page 61 and 62: Table 20. Fast growing companies in
- Page 63 and 64: 7. R&D and employmentThis chapter p
- Page 65 and 66: Table 21 shows the ranking of indus
- Page 67 and 68: Figure 10. One-year employment grow
- Page 69 and 70: Annex 1 - Background informationThe
- Page 71 and 72: Annex 2 - Description of the Scoreb
- Page 73 and 74: Mergers and acquisitions involving
- Page 75 and 76: • Hewlett-Packard, USA acquired 3
- Page 77 and 78: Annex 3 - Methodological notesThe 2
- Page 79 and 80: The database is supplemented by dat
- Page 81 and 82: 1. Funding vs. activityThe focus of
- Page 83 and 84: Standard (IAS) 38 “Intangible ass
- Page 85 and 86: Annex 4 - List of fast growing comp
- Page 87 and 88: Company Country Sector name 4-digit
- Page 89 and 90: Annex 5 -EU1000List of EU1000 and n
- Page 91 and 92: R&D Investment2010change10/09Net Sa
- Page 93 and 94: R&D Investment2010change10/09Net Sa
- Page 95 and 96: R&D Investment2010change10/09Net Sa
- Page 97 and 98:
R&D Investment2010change10/09Net Sa
- Page 99 and 100:
R&D Investment2010change10/09Net Sa
- Page 101 and 102:
R&D Investment2010change10/09Net Sa
- Page 103 and 104:
R&D Investment2010change10/09Net Sa
- Page 105 and 106:
R&D Investment2010change10/09Net Sa
- Page 107 and 108:
R&D Investment2010change10/09Net Sa
- Page 109 and 110:
R&D Investment2010change10/09Net Sa
- Page 111 and 112:
R&D Investment2010change10/09Net Sa
- Page 113 and 114:
R&D Investment2010change10/09Net Sa
- Page 115 and 116:
R&D Investment2010change10/09Net Sa
- Page 117 and 118:
R&D Investment2010change10/09Net Sa
- Page 119 and 120:
R&D Investment2010change10/09Net Sa
- Page 121 and 122:
R&D Investment2010change10/09Net Sa
- Page 123 and 124:
5.2 Ranking of the top 1000 non-EU
- Page 125 and 126:
R&D InvestmentNet SalesR&D/NetSales
- Page 127 and 128:
R&D InvestmentNet SalesR&D/NetSales
- Page 129 and 130:
R&D InvestmentNet SalesR&D/NetSales
- Page 131 and 132:
R&D InvestmentNet SalesR&D/NetSales
- Page 133 and 134:
R&D InvestmentNet SalesR&D/NetSales
- Page 135 and 136:
R&D InvestmentNet SalesR&D/NetSales
- Page 137 and 138:
R&D InvestmentNet SalesR&D/NetSales
- Page 139 and 140:
R&D InvestmentNet SalesR&D/NetSales
- Page 141 and 142:
R&D InvestmentNet SalesR&D/NetSales
- Page 143 and 144:
R&D InvestmentNet SalesR&D/NetSales
- Page 145 and 146:
R&D InvestmentNet SalesR&D/NetSales
- Page 147 and 148:
R&D InvestmentNet SalesR&D/NetSales
- Page 149 and 150:
R&D InvestmentNet SalesR&D/NetSales
- Page 151 and 152:
R&D InvestmentNet SalesR&D/NetSales
- Page 153 and 154:
R&D InvestmentNet SalesR&D/NetSales
- Page 155 and 156:
R&D InvestmentNet SalesR&D/NetSales


