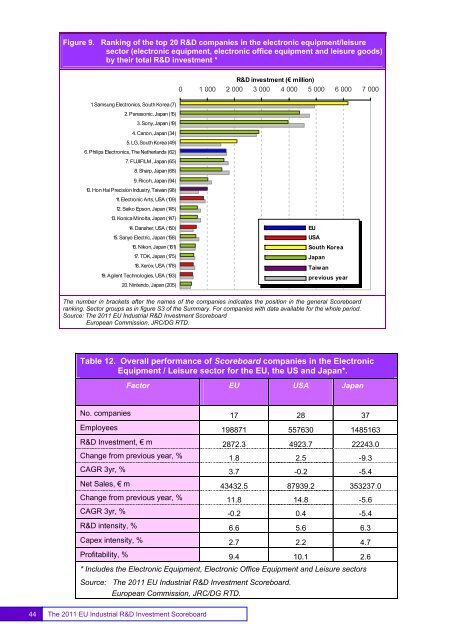
Figure 9. Ranking of the top 20 R&D companies in the electronic equipment/leisuresector (electronic equipment, electronic office equipment and leisure goods)by their total R&D investment *R&D investment (€ million)0 1 000 2 000 3 000 4 000 5 000 6 000 7 0001. Samsung Electronics, South Korea (7)2. Panasonic, Japan (15)3. Sony, Japan (19)4. Canon, Japan (34)5. LG, South Korea (49)6. Philips Electronics, The Netherlands (62)7. FUJIFILM, Japan (65)8. Sharp, Japan (68)9. Ricoh, Japan (94)10. Hon Hai Precision Industry, Taiwan (98)11. Electronic Arts, USA (109)12. Seiko Epson, Japan (145)13. Konica Minolta, Japan (147)14. Danaher, USA (150)15. Sanyo Electric, Japan (158)16. Nikon, Japan (161)17. TDK, Japan (175)18. Xerox, USA (178)19. Agilent Technologies, USA (193)20. Nintendo, Japan (205)<strong>EU</strong>USASouth KoreaJapanTaiwanprevious yearThe number in brackets after the names of the companies indicates the position in the general Scoreboardranking. Sector groups as in figure S3 of the Summary. For companies with data available for the whole period.Source: The <strong>2011</strong> <strong>EU</strong> <strong>Industrial</strong> R&D <strong>Investment</strong> ScoreboardEuropean Commission, JRC/DG RTD.Table 12. Overall performance of Scoreboard companies in the ElectronicEquipment / Leisure sector for the <strong>EU</strong>, the US and Japan*.Factor <strong>EU</strong> USA JapanNo. companies 17 28 37Employees 198871 557630 1485163R&D <strong>Investment</strong>, € m 2872.3 4923.7 22243.0Change from previous year, % 1.8 2.5 -9.3CAGR 3yr, % 3.7 -0.2 -5.4Net Sales, € m 43432.5 87939.2 353237.0Change from previous year, % 11.8 14.8 -5.6CAGR 3yr, % -0.2 0.4 -5.4R&D intensity, % 6.6 5.6 6.3Capex intensity, % 2.7 2.2 4.7Profitability, % 9.4 10.1 2.6* Includes the Electronic Equipment, Electronic Office Equipment and Leisure sectorsSource: The <strong>2011</strong> <strong>EU</strong> <strong>Industrial</strong> R&D <strong>Investment</strong> Scoreboard.European Commission, JRC/DG RTD.44The <strong>2011</strong> <strong>EU</strong> <strong>Industrial</strong> R&D <strong>Investment</strong> Scoreboard
Alternative energyAs observed in previous <strong>Scoreboards</strong>, R&D investments in the field of energyhave been growing rapidly in the past years. This regards in particular, thedevelopment of new energy technologies driven by security of energy supplyand environmental concerns.There are many companies from various sectors in the Scoreboard that dealdirectly with new energy technologies, e.g. oil, gas and electricity, or indirectly,e.g. energy users such as transport related sectors and general industrials andother such as the electronic equipment sector. This means that a number oflarge conglomerates which are major players in the renewable energy sectorsuch as General Electric, Siemens, Abengoa, Sharp and Samsung areclassified under other sectors and are not considered in this analysis.Since 2008, there is also in the Scoreboard the Alternative Energy sector thatcomprises companies fully devoted to technological developments in the field ofrenewable energy technology. In this year's Scoreboard there are 15companies in the Alternative Energy sector that continued to show impressiveperformance (see Table 13). Twelve out of the fifteen companies are based inthe <strong>EU</strong>.In 2010, these 15 companies invested€€817.2 in R&D, showing R&D annualgrowth rates over one and three years of 29.4% and 44.1% respectively.These companies had net sales of €21102.5 and sales growth rates over oneand three years of 23.1% and 22.1%A recent JRC study on 3 alternative energy technologies –Photovoltaics (PV),Wind energy and Concentrated Solar Power (CSP) 18 - further deepens theanalysis on this subsector, including worldwide company data, market supplyand demand factors and the regulatory frameworks. Main conclusions of thisstudy point to:• R&D plays a key role for technology development in these industries but isnot considered the main source of competitive advantage. R&D intensity(R&D as percentage of turnover) of these industries is in the range of themedium R&D-intensity sectors, i.e. 2%-4% (compared with15%-20% inbiotechnology or IT hardware industries). However, equipment manufacturingcompanies of some components, e.g. in the PV industry, invest about 10% oftheir sales in R&D.• In terms of R&D investment, the <strong>EU</strong> companies lead in CSP and wind energyand the non-<strong>EU</strong> companies (USA and Asian) lead in PV. However, recently,there are evidences of much stronger R&D activity in some non-<strong>EU</strong>countries, namely in China, South Korea, India, Japan and the US.• Manufacturing PV, CSP and wind energy technological componentsaccounts for a large share of the value added and jobs of the entire valuechain. Moreover the location of manufacturing facilities depends mainly on18 Hernández, H. and Tübke, A. (<strong>2011</strong>) " Techno-economic analysis of key renewable energy technologies (PV, CSP andwind), JRC Scientific and Technical Reports, <strong>2011</strong>.(http://ipts.jrc.ec.europa.eu/publications/pub.cfm?id=4600)45The <strong>2011</strong> <strong>EU</strong> <strong>Industrial</strong> R&D <strong>Investment</strong> Scoreboard 45