

EU Industrial R&D Investment Scoreboards 2011
EU Industrial R&D Investment Scoreboards 2011
EU Industrial R&D Investment Scoreboards 2011

You also want an ePaper? Increase the reach of your titles
YUMPU automatically turns print PDFs into web optimized ePapers that Google loves.
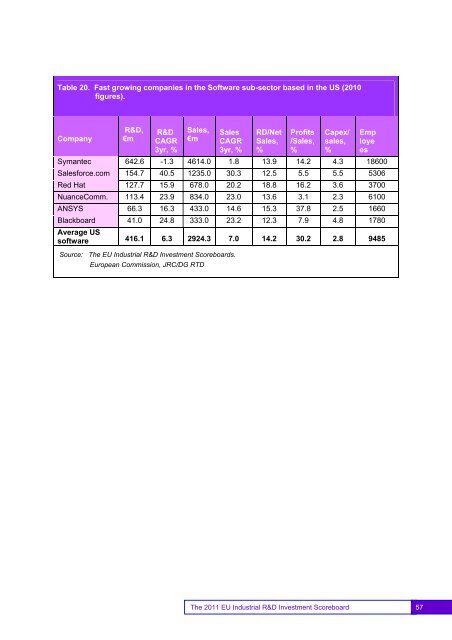
Table 20. Fast growing companies in the Software sub-sector based in the US (2010figures).CompanyR&D,€mR&DCAGR3yr, %Sales,€mSalesCAGR3yr, %RD/NetSales,%Profits/Sales,%Capex/sales,%EmployeesSymantec 642.6 -1.3 4614.0 1.8 13.9 14.2 4.3 18600Salesforce.com 154.7 40.5 1235.0 30.3 12.5 5.5 5.5 5306Red Hat 127.7 15.9 678.0 20.2 18.8 16.2 3.6 3700NuanceComm. 113.4 23.9 834.0 23.0 13.6 3.1 2.3 6100ANSYS 66.3 16.3 433.0 14.6 15.3 37.8 2.5 1660Blackboard 41.0 24.8 333.0 23.2 12.3 7.9 4.8 1780Average USsoftware 416.1 6.3 2924.3 7.0 14.2 30.2 2.8 9485Source: The <strong>EU</strong> <strong>Industrial</strong> R&D <strong>Investment</strong> <strong>Scoreboards</strong>.European Commission, JRC/DG RTD57The <strong>2011</strong> <strong>EU</strong> <strong>Industrial</strong> R&D <strong>Investment</strong> Scoreboard 57


