EU Industrial R&D Investment Scoreboards 2011
EU Industrial R&D Investment Scoreboards 2011
EU Industrial R&D Investment Scoreboards 2011
Create successful ePaper yourself
Turn your PDF publications into a flip-book with our unique Google optimized e-Paper software.
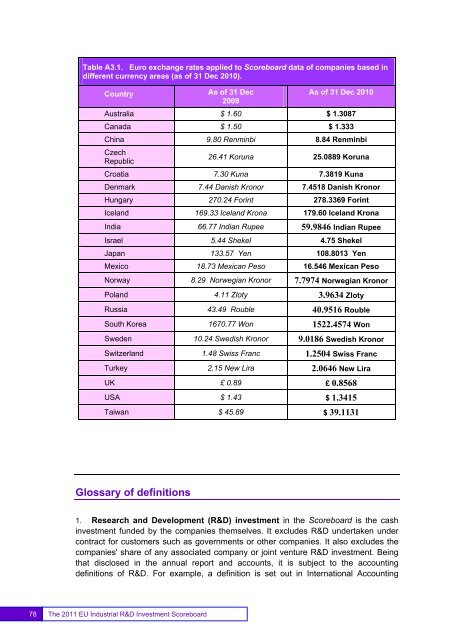
Table A3.1. Euro exchange rates applied to Scoreboard data of companies based indifferent currency areas (as of 31 Dec 2010).CountryAs of 31 Dec2009As of 31 Dec 2010Australia $ 1.60 $ 1.3087Canada $ 1.50 $ 1.333China 9.80 Renminbi 8.84 RenminbiCzechRepublic26.41 Koruna 25.0889 KorunaCroatia 7.30 Kuna 7.3819 KunaDenmark 7.44 Danish Kronor 7.4518 Danish KronorHungary 270.24 Forint 278.3369 ForintIceland 169.33 Iceland Krona 179.60 Iceland KronaIndia 66.77 Indian Rupee 59.9846 Indian RupeeIsrael 5.44 Shekel 4.75 ShekelJapan 133.57 Yen 108.8013 YenMexico 18.73 Mexican Peso 16.546 Mexican PesoNorway 8.29 Norwegian Kronor 7.7974 Norwegian KronorPoland 4.11 Zloty 3.9634 ZlotyRussia 43.49 Rouble 40.9516 RoubleSouth Korea 1670.77 Won 1522.4574 WonSweden 10.24 Swedish Kronor 9.0186 Swedish KronorSwitzerland 1.48 Swiss Franc 1.2504 Swiss FrancTurkey 2.15 New Lira 2.0646 New LiraUK £ 0.89 £ 0.8568USA $ 1.43 $ 1.3415Taiwan $ 45.89 $ 39.1131Glossary of definitions1. Research and Development (R&D) investment in the Scoreboard is the cashinvestment funded by the companies themselves. It excludes R&D undertaken undercontract for customers such as governments or other companies. It also excludes thecompanies' share of any associated company or joint venture R&D investment. Beingthat disclosed in the annual report and accounts, it is subject to the accountingdefinitions of R&D. For example, a definition is set out in International Accounting78The <strong>2011</strong> <strong>EU</strong> <strong>Industrial</strong> R&D <strong>Investment</strong> Scoreboard


