EU Industrial R&D Investment Scoreboards 2011
EU Industrial R&D Investment Scoreboards 2011
EU Industrial R&D Investment Scoreboards 2011
Create successful ePaper yourself
Turn your PDF publications into a flip-book with our unique Google optimized e-Paper software.
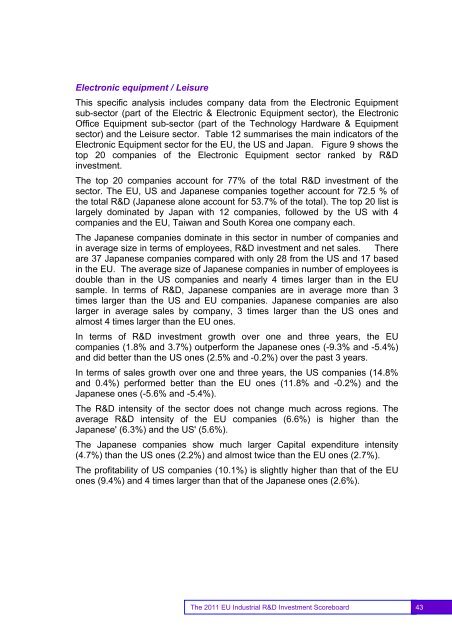
Electronic equipment / LeisureThis specific analysis includes company data from the Electronic Equipmentsub-sector (part of the Electric & Electronic Equipment sector), the ElectronicOffice Equipment sub-sector (part of the Technology Hardware & Equipmentsector) and the Leisure sector. Table 12 summarises the main indicators of theElectronic Equipment sector for the <strong>EU</strong>, the US and Japan. Figure 9 shows thetop 20 companies of the Electronic Equipment sector ranked by R&Dinvestment.The top 20 companies account for 77% of the total R&D investment of thesector. The <strong>EU</strong>, US and Japanese companies together account for 72.5 % ofthe total R&D (Japanese alone account for 53.7% of the total). The top 20 list islargely dominated by Japan with 12 companies, followed by the US with 4companies and the <strong>EU</strong>, Taiwan and South Korea one company each.The Japanese companies dominate in this sector in number of companies andin average size in terms of employees, R&D investment and net sales. Thereare 37 Japanese companies compared with only 28 from the US and 17 basedin the <strong>EU</strong>. The average size of Japanese companies in number of employees isdouble than in the US companies and nearly 4 times larger than in the <strong>EU</strong>sample. In terms of R&D, Japanese companies are in average more than 3times larger than the US and <strong>EU</strong> companies. Japanese companies are alsolarger in average sales by company, 3 times larger than the US ones andalmost 4 times larger than the <strong>EU</strong> ones.In terms of R&D investment growth over one and three years, the <strong>EU</strong>companies (1.8% and 3.7%) outperform the Japanese ones (-9.3% and -5.4%)and did better than the US ones (2.5% and -0.2%) over the past 3 years.In terms of sales growth over one and three years, the US companies (14.8%and 0.4%) performed better than the <strong>EU</strong> ones (11.8% and -0.2%) and theJapanese ones (-5.6% and -5.4%).The R&D intensity of the sector does not change much across regions. Theaverage R&D intensity of the <strong>EU</strong> companies (6.6%) is higher than theJapanese' (6.3%) and the US' (5.6%).The Japanese companies show much larger Capital expenditure intensity(4.7%) than the US ones (2.2%) and almost twice than the <strong>EU</strong> ones (2.7%).The profitability of US companies (10.1%) is slightly higher than that of the <strong>EU</strong>ones (9.4%) and 4 times larger than that of the Japanese ones (2.6%).43The <strong>2011</strong> <strong>EU</strong> <strong>Industrial</strong> R&D <strong>Investment</strong> Scoreboard 43


