

EU Industrial R&D Investment Scoreboards 2011
EU Industrial R&D Investment Scoreboards 2011
EU Industrial R&D Investment Scoreboards 2011

Create successful ePaper yourself
Turn your PDF publications into a flip-book with our unique Google optimized e-Paper software.
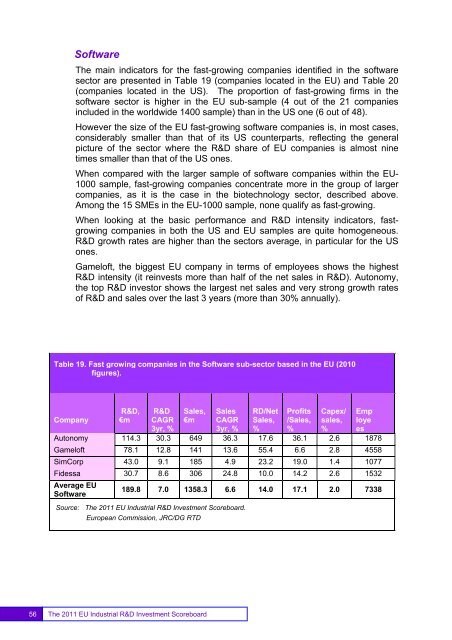
SoftwareThe main indicators for the fast-growing companies identified in the softwaresector are presented in Table 19 (companies located in the <strong>EU</strong>) and Table 20(companies located in the US). The proportion of fast-growing firms in thesoftware sector is higher in the <strong>EU</strong> sub-sample (4 out of the 21 companiesincluded in the worldwide 1400 sample) than in the US one (6 out of 48).However the size of the <strong>EU</strong> fast-growing software companies is, in most cases,considerably smaller than that of its US counterparts, reflecting the generalpicture of the sector where the R&D share of <strong>EU</strong> companies is almost ninetimes smaller than that of the US ones.When compared with the larger sample of software companies within the <strong>EU</strong>-1000 sample, fast-growing companies concentrate more in the group of largercompanies, as it is the case in the biotechnology sector, described above.Among the 15 SMEs in the <strong>EU</strong>-1000 sample, none qualify as fast-growing.When looking at the basic performance and R&D intensity indicators, fastgrowingcompanies in both the US and <strong>EU</strong> samples are quite homogeneous.R&D growth rates are higher than the sectors average, in particular for the USones.Gameloft, the biggest <strong>EU</strong> company in terms of employees shows the highestR&D intensity (it reinvests more than half of the net sales in R&D). Autonomy,the top R&D investor shows the largest net sales and very strong growth ratesof R&D and sales over the last 3 years (more than 30% annually).Table 19. Fast growing companies in the Software sub-sector based in the <strong>EU</strong> (2010figures).CompanyR&D,€mR&DCAGR3yr, %Sales,€mSalesCAGR3yr, %RD/NetSales,%Profits/Sales,%Capex/sales,%EmployeesAutonomy 114.3 30.3 649 36.3 17.6 36.1 2.6 1878Gameloft 78.1 12.8 141 13.6 55.4 6.6 2.8 4558SimCorp 43.0 9.1 185 4.9 23.2 19.0 1.4 1077Fidessa 30.7 8.6 306 24.8 10.0 14.2 2.6 1532Average <strong>EU</strong>Software189.8 7.0 1358.3 6.6 14.0 17.1 2.0 7338Source: The <strong>2011</strong> <strong>EU</strong> <strong>Industrial</strong> R&D <strong>Investment</strong> Scoreboard.European Commission, JRC/DG RTD56The <strong>2011</strong> <strong>EU</strong> <strong>Industrial</strong> R&D <strong>Investment</strong> Scoreboard


