

EU Industrial R&D Investment Scoreboards 2011
EU Industrial R&D Investment Scoreboards 2011
EU Industrial R&D Investment Scoreboards 2011

Create successful ePaper yourself
Turn your PDF publications into a flip-book with our unique Google optimized e-Paper software.
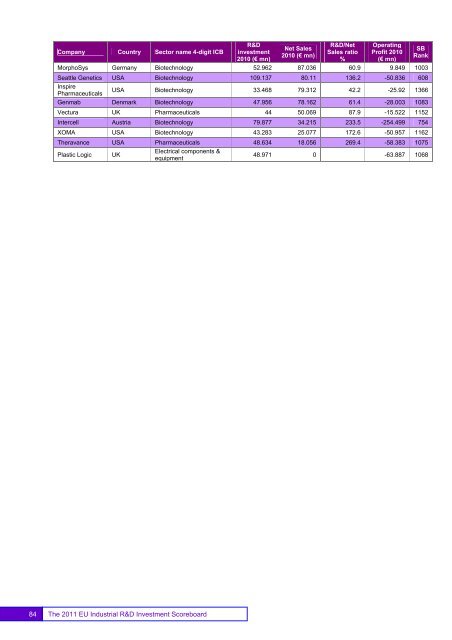
Company Country Sector name 4-digit ICBR&Dinvestment2010 (€ mn)Net Sales2010 (€ mn)R&D/NetSales ratio%OperatingProfit 2010(€ mn)MorphoSys Germany Biotechnology 52.962 87.036 60.9 9.849 1003Seattle Genetics USA Biotechnology 109.137 80.11 136.2 -50.836 608InspirePharmaceuticalsUSA Biotechnology 33.468 79.312 42.2 -25.92 1366Genmab Denmark Biotechnology 47.956 78.162 61.4 -28.003 1083Vectura UK Pharmaceuticals 44 50.069 87.9 -15.522 1152Intercell Austria Biotechnology 79.877 34.215 233.5 -254.499 754XOMA USA Biotechnology 43.283 25.077 172.6 -50.957 1162Theravance USA Pharmaceuticals 48.634 18.056 269.4 -58.383 1075Plastic Logic UKElectrical components &equipment48.971 0 -63.887 1068SBRank84The <strong>2011</strong> <strong>EU</strong> <strong>Industrial</strong> R&D <strong>Investment</strong> Scoreboard


