

EU Industrial R&D Investment Scoreboards 2011
EU Industrial R&D Investment Scoreboards 2011
EU Industrial R&D Investment Scoreboards 2011

You also want an ePaper? Increase the reach of your titles
YUMPU automatically turns print PDFs into web optimized ePapers that Google loves.
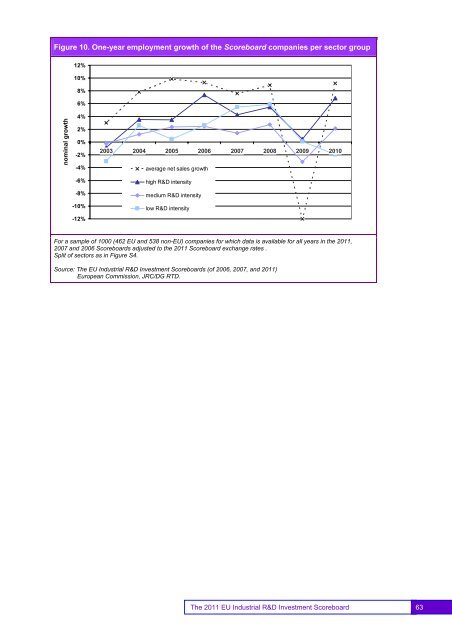
Figure 10. One-year employment growth of the Scoreboard companies per sector group12%10%8%6%nominal growth4%2%0%-2%-4%20032004 2005 2006average net sales growth2007200820092010-6%high R&D intensity-8%medium R&D intensity-10%low R&D intensity-12%For a sample of 1000 (462 <strong>EU</strong> and 538 non-<strong>EU</strong>) companies for which data is available for all years in the <strong>2011</strong>,2007 and 2006 <strong>Scoreboards</strong> adjusted to the <strong>2011</strong> Scoreboard exchange rates .Split of sectors as in Figure S4.Source: The <strong>EU</strong> <strong>Industrial</strong> R&D <strong>Investment</strong> <strong>Scoreboards</strong> (of 2006, 2007, and <strong>2011</strong>)European Commission, JRC/DG RTD.63The <strong>2011</strong> <strong>EU</strong> <strong>Industrial</strong> R&D <strong>Investment</strong> Scoreboard 63


