

EU Industrial R&D Investment Scoreboards 2011
EU Industrial R&D Investment Scoreboards 2011
EU Industrial R&D Investment Scoreboards 2011

You also want an ePaper? Increase the reach of your titles
YUMPU automatically turns print PDFs into web optimized ePapers that Google loves.
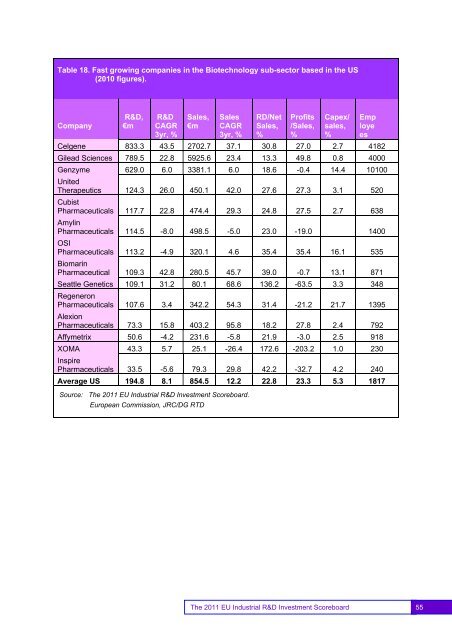
Table 18. Fast growing companies in the Biotechnology sub-sector based in the US(2010 figures).CompanyR&D,€mR&DCAGR3yr, %Sales,€mSalesCAGR3yr, %RD/NetSales,%Profits/Sales,%Capex/sales,%EmployeesCelgene 833.3 43.5 2702.7 37.1 30.8 27.0 2.7 4182Gilead Sciences 789.5 22.8 5925.6 23.4 13.3 49.8 0.8 4000Genzyme 629.0 6.0 3381.1 6.0 18.6 -0.4 14.4 10100UnitedTherapeutics 124.3 26.0 450.1 42.0 27.6 27.3 3.1 520CubistPharmaceuticals 117.7 22.8 474.4 29.3 24.8 27.5 2.7 638AmylinPharmaceuticals 114.5 -8.0 498.5 -5.0 23.0 -19.0 1400OSIPharmaceuticals 113.2 -4.9 320.1 4.6 35.4 35.4 16.1 535BiomarinPharmaceutical 109.3 42.8 280.5 45.7 39.0 -0.7 13.1 871Seattle Genetics 109.1 31.2 80.1 68.6 136.2 -63.5 3.3 348RegeneronPharmaceuticals 107.6 3.4 342.2 54.3 31.4 -21.2 21.7 1395AlexionPharmaceuticals 73.3 15.8 403.2 95.8 18.2 27.8 2.4 792Affymetrix 50.6 -4.2 231.6 -5.8 21.9 -3.0 2.5 918XOMA 43.3 5.7 25.1 -26.4 172.6 -203.2 1.0 230InspirePharmaceuticals 33.5 -5.6 79.3 29.8 42.2 -32.7 4.2 240Average US 194.8 8.1 854.5 12.2 22.8 23.3 5.3 1817Source: The <strong>2011</strong> <strong>EU</strong> <strong>Industrial</strong> R&D <strong>Investment</strong> Scoreboard.European Commission, JRC/DG RTD55The <strong>2011</strong> <strong>EU</strong> <strong>Industrial</strong> R&D <strong>Investment</strong> Scoreboard 55


