

EU Industrial R&D Investment Scoreboards 2011
EU Industrial R&D Investment Scoreboards 2011
EU Industrial R&D Investment Scoreboards 2011

You also want an ePaper? Increase the reach of your titles
YUMPU automatically turns print PDFs into web optimized ePapers that Google loves.
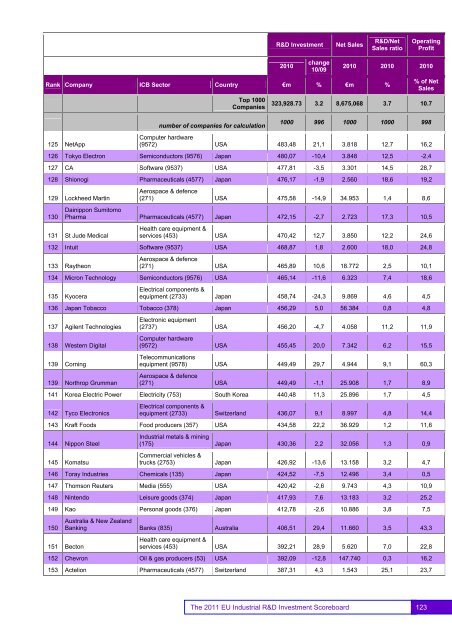
R&D <strong>Investment</strong>Net SalesR&D/NetSales ratioOperatingProfit2010change10/092010 2010 2010Rank Company ICB Sector Country €m % €m %Top 1000Companies% of NetSales323,928.73 3.2 8,675,068 3.7 10.7number of companies for calculation1000 996 1000 1000 998125 NetAppComputer hardware(9572) USA 483,48 21,1 3.818 12,7 16,2126 Tokyo Electron Semiconductors (9576) Japan 480,07 -10,4 3.848 12,5 -2,4127 CA Software (9537) USA 477,81 -3,5 3.301 14,5 28,7128 Shionogi Pharmaceuticals (4577) Japan 476,17 -1,9 2.560 18,6 19,2129 Lockheed Martin130Aerospace & defence(271) USA 475,58 -14,9 34.953 1,4 8,6Dainippon SumitomoPharma Pharmaceuticals (4577) Japan 472,15 -2,7 2.723 17,3 10,5131 St Jude MedicalHealth care equipment &services (453) USA 470,42 12,7 3.850 12,2 24,6132 Intuit Software (9537) USA 468,87 1,8 2.600 18,0 24,8133 RaytheonAerospace & defence(271) USA 465,89 10,6 18.772 2,5 10,1134 Micron Technology Semiconductors (9576) USA 465,14 -11,6 6.323 7,4 18,6135 KyoceraElectrical components &equipment (2733) Japan 458,74 -24,3 9.869 4,6 4,5136 Japan Tobacco Tobacco (378) Japan 456,29 5,0 56.384 0,8 4,8137 Agilent Technologies138 Western Digital139 Corning139 Northrop GrummanElectronic equipment(2737) USA 456,20 -4,7 4.058 11,2 11,9Computer hardware(9572) USA 455,45 20,0 7.342 6,2 15,5Telecommunicationsequipment (9578) USA 449,49 29,7 4.944 9,1 60,3Aerospace & defence(271) USA 449,49 -1,1 25.908 1,7 8,9141 Korea Electric Power Electricity (753) South Korea 440,48 11,3 25.896 1,7 4,5142 Tyco ElectronicsElectrical components &equipment (2733) Switzerland 436,07 9,1 8.997 4,8 14,4143 Kraft Foods Food producers (357) USA 434,58 22,2 36.929 1,2 11,6144 Nippon Steel145 Komatsu<strong>Industrial</strong> metals & mining(175) Japan 430,36 2,2 32.056 1,3 0,9Commercial vehicles &trucks (2753) Japan 426,92 -13,6 13.158 3,2 4,7146 Toray Industries Chemicals (135) Japan 424,52 -7,5 12.496 3,4 0,5147 Thomson Reuters Media (555) USA 420,42 -2,6 9.743 4,3 10,9148 Nintendo Leisure goods (374) Japan 417,93 7,6 13.183 3,2 25,2149 Kao Personal goods (376) Japan 412,78 -2,6 10.886 3,8 7,5150Australia & New ZealandBanking Banks (835) Australia 406,51 29,4 11.660 3,5 43,3151 BectonHealth care equipment &services (453) USA 392,21 28,9 5.620 7,0 22,8152 Chevron Oil & gas producers (53) USA 392,09 -12,8 147.740 0,3 16,2153 Actelion Pharmaceuticals (4577) Switzerland 387,31 4,3 1.543 25,1 23,7123The <strong>2011</strong> <strong>EU</strong> <strong>Industrial</strong> R&D <strong>Investment</strong> Scoreboard 123


