EU Industrial R&D Investment Scoreboards 2011
EU Industrial R&D Investment Scoreboards 2011
EU Industrial R&D Investment Scoreboards 2011
Create successful ePaper yourself
Turn your PDF publications into a flip-book with our unique Google optimized e-Paper software.
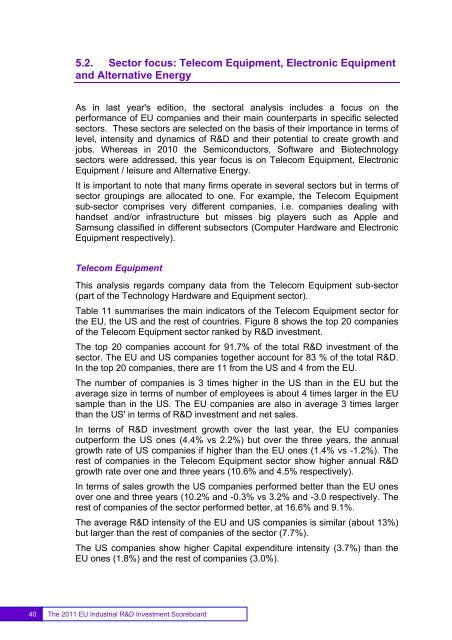
5.2. Sector focus: Telecom Equipment, Electronic Equipmentand Alternative EnergyAs in last year's edition, the sectoral analysis includes a focus on theperformance of <strong>EU</strong> companies and their main counterparts in specific selectedsectors. These sectors are selected on the basis of their importance in terms oflevel, intensity and dynamics of R&D and their potential to create growth andjobs. Whereas in 2010 the Semiconductors, Software and Biotechnologysectors were addressed, this year focus is on Telecom Equipment, ElectronicEquipment / leisure and Alternative Energy.It is important to note that many firms operate in several sectors but in terms ofsector groupings are allocated to one. For example, the Telecom Equipmentsub-sector comprises very different companies, i.e. companies dealing withhandset and/or infrastructure but misses big players such as Apple andSamsung classified in different subsectors (Computer Hardware and ElectronicEquipment respectively).Telecom EquipmentThis analysis regards company data from the Telecom Equipment sub-sector(part of the Technology Hardware and Equipment sector).Table 11 summarises the main indicators of the Telecom Equipment sector forthe <strong>EU</strong>, the US and the rest of countries. Figure 8 shows the top 20 companiesof the Telecom Equipment sector ranked by R&D investment.The top 20 companies account for 91.7% of the total R&D investment of thesector. The <strong>EU</strong> and US companies together account for 83 % of the total R&D.In the top 20 companies, there are 11 from the US and 4 from the <strong>EU</strong>.The number of companies is 3 times higher in the US than in the <strong>EU</strong> but theaverage size in terms of number of employees is about 4 times larger in the <strong>EU</strong>sample than in the US. The <strong>EU</strong> companies are also in average 3 times largerthan the US' in terms of R&D investment and net sales.In terms of R&D investment growth over the last year, the <strong>EU</strong> companiesoutperform the US ones (4.4% vs 2.2%) but over the three years, the annualgrowth rate of US companies if higher than the <strong>EU</strong> ones (1.4% vs -1.2%). Therest of companies in the Telecom Equipment sector show higher annual R&Dgrowth rate over one and three years (10.6% and 4.5% respectively).In terms of sales growth the US companies performed better than the <strong>EU</strong> onesover one and three years (10.2% and -0.3% vs 3.2% and -3.0 respectively. Therest of companies of the sector performed better, at 16.6% and 9.1%.The average R&D intensity of the <strong>EU</strong> and US companies is similar (about 13%)but larger than the rest of companies of the sector (7.7%).The US companies show higher Capital expenditure intensity (3.7%) than the<strong>EU</strong> ones (1.8%) and the rest of companies (3.0%).40The <strong>2011</strong> <strong>EU</strong> <strong>Industrial</strong> R&D <strong>Investment</strong> Scoreboard


