EU Industrial R&D Investment Scoreboards 2011
EU Industrial R&D Investment Scoreboards 2011
EU Industrial R&D Investment Scoreboards 2011
Create successful ePaper yourself
Turn your PDF publications into a flip-book with our unique Google optimized e-Paper software.
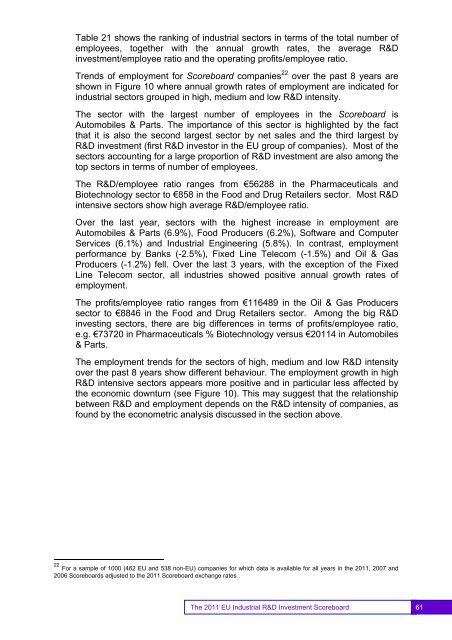
Table 21 shows the ranking of industrial sectors in terms of the total number ofemployees, together with the annual growth rates, the average R&Dinvestment/employee ratio and the operating profits/employee ratio.Trends of employment for Scoreboard companies 22 over the past 8 years areshown in Figure 10 where annual growth rates of employment are indicated forindustrial sectors grouped in high, medium and low R&D intensity.The sector with the largest number of employees in the Scoreboard isAutomobiles & Parts. The importance of this sector is highlighted by the factthat it is also the second largest sector by net sales and the third largest byR&D investment (first R&D investor in the <strong>EU</strong> group of companies). Most of thesectors accounting for a large proportion of R&D investment are also among thetop sectors in terms of number of employees.The R&D/employee ratio ranges from €56288 in the Pharmaceuticals andBiotechnology sector to €858 in the Food and Drug Retailers sector. Most R&Dintensive sectors show high average R&D/employee ratio.Over the last year, sectors with the highest increase in employment areAutomobiles & Parts (6.9%), Food Producers (6.2%), Software and ComputerServices (6.1%) and <strong>Industrial</strong> Engineering (5.8%). In contrast, employmentperformance by Banks (-2.5%), Fixed Line Telecom (-1.5%) and Oil & GasProducers (-1.2%) fell. Over the last 3 years, with the exception of the FixedLine Telecom sector, all industries showed positive annual growth rates ofemployment.The profits/employee ratio ranges from €116489 in the Oil & Gas Producerssector to €8846 in the Food and Drug Retailers sector. Among the big R&Dinvesting sectors, there are big differences in terms of profits/employee ratio,e.g. €73720 in Pharmaceuticals % Biotechnology versus €<strong>2011</strong>4 in Automobiles& Parts.The employment trends for the sectors of high, medium and low R&D intensityover the past 8 years show different behaviour. The employment growth in highR&D intensive sectors appears more positive and in particular less affected bythe economic downturn (see Figure 10). This may suggest that the relationshipbetween R&D and employment depends on the R&D intensity of companies, asfound by the econometric analysis discussed in the section above.22 For a sample of 1000 (462 <strong>EU</strong> and 538 non-<strong>EU</strong>) companies for which data is available for all years in the <strong>2011</strong>, 2007 and2006 <strong>Scoreboards</strong> adjusted to the <strong>2011</strong> Scoreboard exchange rates .61The <strong>2011</strong> <strong>EU</strong> <strong>Industrial</strong> R&D <strong>Investment</strong> Scoreboard 61


