

EU Industrial R&D Investment Scoreboards 2011
EU Industrial R&D Investment Scoreboards 2011
EU Industrial R&D Investment Scoreboards 2011

Create successful ePaper yourself
Turn your PDF publications into a flip-book with our unique Google optimized e-Paper software.
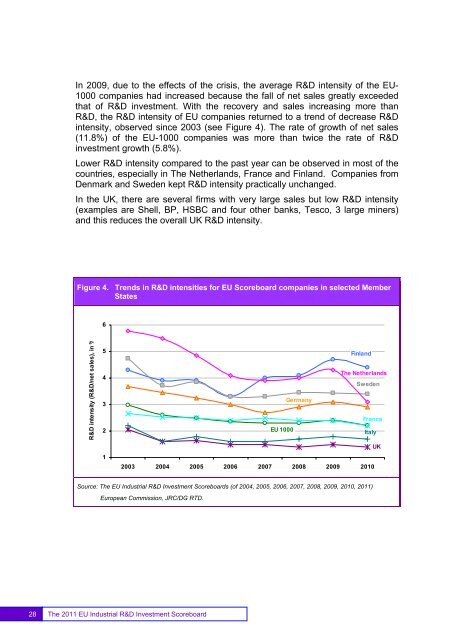
In 2009, due to the effects of the crisis, the average R&D intensity of the <strong>EU</strong>-1000 companies had increased because the fall of net sales greatly exceededthat of R&D investment. With the recovery and sales increasing more thanR&D, the R&D intensity of <strong>EU</strong> companies returned to a trend of decrease R&Dintensity, observed since 2003 (see Figure 4). The rate of growth of net sales(11.8%) of the <strong>EU</strong>-1000 companies was more than twice the rate of R&Dinvestment growth (5.8%).Lower R&D intensity compared to the past year can be observed in most of thecountries, especially in The Netherlands, France and Finland. Companies fromDenmark and Sweden kept R&D intensity practically unchanged.In the UK, there are several firms with very large sales but low R&D intensity(examples are Shell, BP, HSBC and four other banks, Tesco, 3 large miners)and this reduces the overall UK R&D intensity.Figure 4. Trends in R&D intensities for <strong>EU</strong> Scoreboard companies in selected MemberStates6R&D intensity (R&D/net sales), in %54321FinlandThe NetherlandsSwedenGermanyFrance<strong>EU</strong> 1000ItalyUK2003 2004 2005 2006 2007 2008 2009 2010Source: The <strong>EU</strong> <strong>Industrial</strong> R&D <strong>Investment</strong> <strong>Scoreboards</strong> (of 2004, 2005, 2006, 2007, 2008, 2009, 2010, <strong>2011</strong>)European Commission, JRC/DG RTD.28The <strong>2011</strong> <strong>EU</strong> <strong>Industrial</strong> R&D <strong>Investment</strong> Scoreboard


