

EU Industrial R&D Investment Scoreboards 2011
EU Industrial R&D Investment Scoreboards 2011
EU Industrial R&D Investment Scoreboards 2011

Create successful ePaper yourself
Turn your PDF publications into a flip-book with our unique Google optimized e-Paper software.
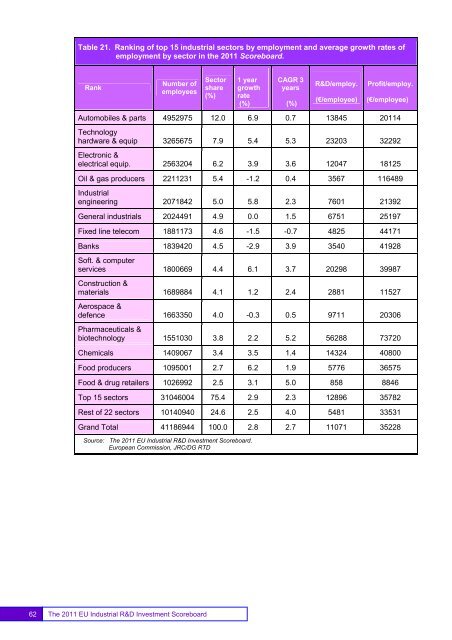
Table 21. Ranking of top 15 industrial sectors by employment and average growth rates ofemployment by sector in the <strong>2011</strong> Scoreboard.RankNumber ofemployeesSectorshare(%)1 yeargrowthrate(%)CAGR 3years(%)R&D/employ.(€/employee)Profit/employ.(€/employee)Automobiles & parts 4952975 12.0 6.9 0.7 13845 <strong>2011</strong>4Technologyhardware & equip 3265675 7.9 5.4 5.3 23203 32292Electronic &electrical equip. 2563204 6.2 3.9 3.6 12047 18125Oil & gas producers 2211231 5.4 -1.2 0.4 3567 116489<strong>Industrial</strong>engineering 2071842 5.0 5.8 2.3 7601 21392General industrials 2024491 4.9 0.0 1.5 6751 25197Fixed line telecom 1881173 4.6 -1.5 -0.7 4825 44171Banks 1839420 4.5 -2.9 3.9 3540 41928Soft. & computerservices 1800669 4.4 6.1 3.7 20298 39987Construction &materials 1689884 4.1 1.2 2.4 2881 11527Aerospace &defence 1663350 4.0 -0.3 0.5 9711 20306Pharmaceuticals &biotechnology 1551030 3.8 2.2 5.2 56288 73720Chemicals 1409067 3.4 3.5 1.4 14324 40800Food producers 1095001 2.7 6.2 1.9 5776 36575Food & drug retailers 1026992 2.5 3.1 5.0 858 8846Top 15 sectors 31046004 75.4 2.9 2.3 12896 35782Rest of 22 sectors 10140940 24.6 2.5 4.0 5481 33531Grand Total 41186944 100.0 2.8 2.7 11071 35228Source: The <strong>2011</strong> <strong>EU</strong> <strong>Industrial</strong> R&D <strong>Investment</strong> Scoreboard.European Commission, JRC/DG RTD62The <strong>2011</strong> <strong>EU</strong> <strong>Industrial</strong> R&D <strong>Investment</strong> Scoreboard


