1+2/2010 - SpoleÄnost pro pojivové tkánÄ›
1+2/2010 - SpoleÄnost pro pojivové tkánÄ›
1+2/2010 - SpoleÄnost pro pojivové tkánÄ›

You also want an ePaper? Increase the reach of your titles
YUMPU automatically turns print PDFs into web optimized ePapers that Google loves.
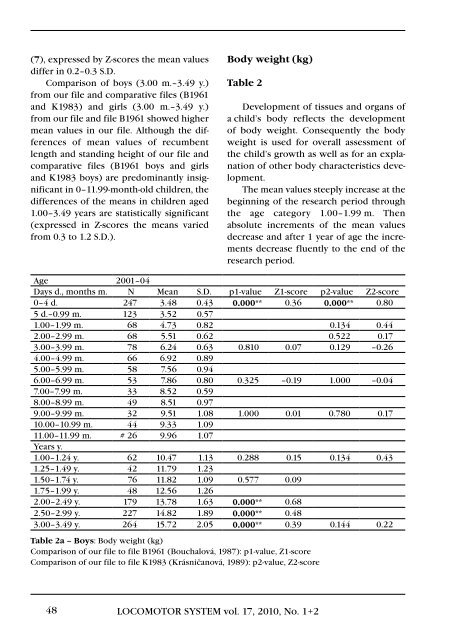
(7), expressed by Z-scores the mean valuesdiffer in 0.2–0.3 S.D.Comparison of boys (3.00 m.–3.49 y.)from our file and comparative files (B1961and K1983) and girls (3.00 m.–3.49 y.)from our file and file B1961 showed highermean values in our file. Although the differencesof mean values of recumbentlength and standing height of our file andcomparative files (B1961 boys and girlsand K1983 boys) are predominantly insignificantin 0–11.99-month-old children, thedifferen ces of the means in children aged1.00–3.49 years are statistically significant(expressed in Z-scores the means variedfrom 0.3 to 1.2 S.D.).Body weight (kg)Table 2Development of tissues and organs ofa child’s body reflects the developmentof body weight. Consequently the bodyweight is used for overall assessment ofthe child’s growth as well as for an explanationof other body characteristics development.The mean values steeply increase at thebeginning of the research period throughthe age category 1.00–1.99 m. Thenabsolute increments of the mean valuesdecrease and after 1 year of age the incrementsdecrease fluently to the end of theresearch period.Age 2001–04Days d., months m. N Mean S.D. p1-value Z1-score p2-value Z2-score0–4 d. 247 3.48 0.43 0.000** 0.36 0.000** 0.805 d.–0.99 m. 123 3.52 0.571.00–1.99 m. 68 4.73 0.82 0.134 0.442.00–2.99 m. 68 5.51 0.62 0.522 0.173.00–3.99 m. 78 6.24 0.63 0.810 0.07 0.129 –0.264.00–4.99 m. 66 6.92 0.895.00–5.99 m. 58 7.56 0.946.00–6.99 m. 53 7.86 0.80 0.325 –0.19 1.000 –0.047.00–7.99 m. 33 8.52 0.598.00–8.99 m. 49 8.51 0.979.00–9.99 m. 32 9.51 1.08 1.000 0.01 0.780 0.1710.00–10.99 m. 44 9.33 1.0911.00–11.99 m. # 26 9.96 1.07Years y.1.00–1.24 y. 62 10.47 1.13 0.288 0.15 0.134 0.431.25–1.49 y. 42 11.79 1.231.50–1.74 y. 76 11.82 1.09 0.577 0.091.75–1.99 y. 48 12.56 1.262.00–2.49 y. 179 13.78 1.63 0.000** 0.682.50–2.99 y. 227 14.82 1.89 0.000** 0.483.00–3.49 y. 264 15.72 2.05 0.000** 0.39 0.144 0.22Table 2a – Boys: Body weight (kg)Comparison of our file to file B1961 (Bouchalová, 1987): p1-value, Z1-scoreComparison of our file to file K1983 (Krásničanová, 1989): p2-value, Z2-score48LOCOMOTOR SYSTEM vol. 17, <strong>2010</strong>, No. <strong>1+2</strong>