

STATISTICS â UNDERSTANDING HYPOTHESIS TESTS
STATISTICS â UNDERSTANDING HYPOTHESIS TESTS
STATISTICS â UNDERSTANDING HYPOTHESIS TESTS

You also want an ePaper? Increase the reach of your titles
YUMPU automatically turns print PDFs into web optimized ePapers that Google loves.
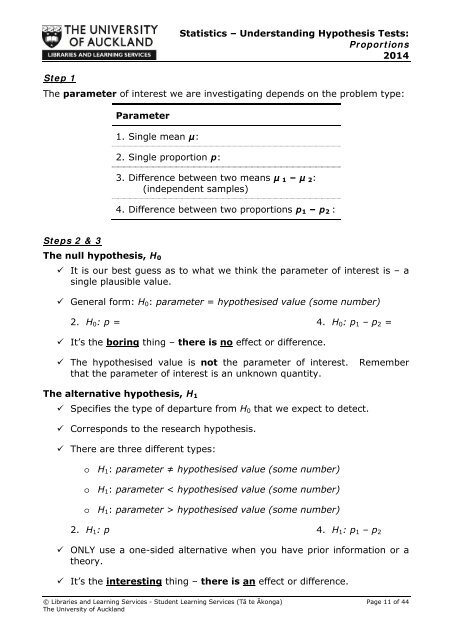
Step 1Statistics – Understanding Hypothesis Tests:Proportions2014The parameter of interest we are investigating depends on the problem type:Parameter1. Single mean µ:2. Single proportion p:3. Difference between two means µ 1 – µ 2:(independent samples)4. Difference between two proportions p 1 – p 2 :Steps 2 & 3The null hypothesis, H 0 It is our best guess as to what we think the parameter of interest is – asingle plausible value. General form: H 0 : parameter = hypothesised value (some number)2. H 0 : p = 4. H 0 : p 1 – p 2 = It’s the boring thing – there is no effect or difference. The hypothesised value is not the parameter of interest. Rememberthat the parameter of interest is an unknown quantity.The alternative hypothesis, H 1 Specifies the type of departure from H 0 that we expect to detect. Corresponds to the research hypothesis. There are three different types:o H 1 : parameter ≠ hypothesised value (some number)o H 1 : parameter < hypothesised value (some number)o H 1 : parameter > hypothesised value (some number)2. H 1 : p 4. H 1 : p 1 – p 2 ONLY use a one-sided alternative when you have prior information or atheory. It’s the interesting thing – there is an effect or difference.© Libraries and Learning Services - Student Learning Services (Tā te Ākonga) Page 11 of 44The University of Auckland


