

STATISTICS â UNDERSTANDING HYPOTHESIS TESTS
STATISTICS â UNDERSTANDING HYPOTHESIS TESTS
STATISTICS â UNDERSTANDING HYPOTHESIS TESTS

You also want an ePaper? Increase the reach of your titles
YUMPU automatically turns print PDFs into web optimized ePapers that Google loves.
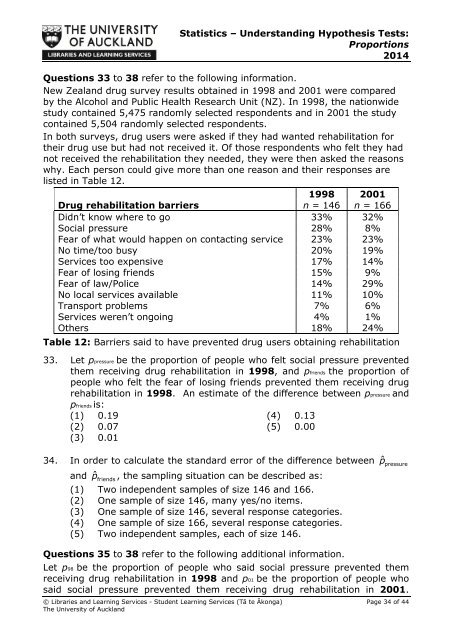
Statistics – Understanding Hypothesis Tests:Proportions2014Questions 33 to 38 refer to the following information.New Zealand drug survey results obtained in 1998 and 2001 were comparedby the Alcohol and Public Health Research Unit (NZ). In 1998, the nationwidestudy contained 5,475 randomly selected respondents and in 2001 the studycontained 5,504 randomly selected respondents.In both surveys, drug users were asked if they had wanted rehabilitation fortheir drug use but had not received it. Of those respondents who felt they hadnot received the rehabilitation they needed, they were then asked the reasonswhy. Each person could give more than one reason and their responses arelisted in Table 12.1998 2001Drug rehabilitation barriers n = 146 n = 166Didn’t know where to go 33% 32%Social pressure 28% 8%Fear of what would happen on contacting service 23% 23%No time/too busy 20% 19%Services too expensive 17% 14%Fear of losing friends 15% 9%Fear of law/Police 14% 29%No local services available 11% 10%Transport problems 7% 6%Services weren’t ongoing 4% 1%Others 18% 24%Table 12: Barriers said to have prevented drug users obtaining rehabilitation33. Let ppressure be the proportion of people who felt social pressure preventedthem receiving drug rehabilitation in 1998, and pfriends the proportion ofpeople who felt the fear of losing friends prevented them receiving drugrehabilitation in 1998. An estimate of the difference between ppressure andpfriends is:(1) 0.19(2) 0.07(3) 0.01(4) 0.13(5) 0.0034. In order to calculate the standard error of the difference between ˆp pressureand ˆpfriends, the sampling situation can be described as:(1) Two independent samples of size 146 and 166.(2) One sample of size 146, many yes/no items.(3) One sample of size 146, several response categories.(4) One sample of size 166, several response categories.(5) Two independent samples, each of size 146.Questions 35 to 38 refer to the following additional information.Let p98 be the proportion of people who said social pressure prevented themreceiving drug rehabilitation in 1998 and p01 be the proportion of people whosaid social pressure prevented them receiving drug rehabilitation in 2001.© Libraries and Learning Services - Student Learning Services (Tā te Ākonga) Page 34 of 44The University of Auckland


