

STATISTICS â UNDERSTANDING HYPOTHESIS TESTS
STATISTICS â UNDERSTANDING HYPOTHESIS TESTS
STATISTICS â UNDERSTANDING HYPOTHESIS TESTS

Create successful ePaper yourself
Turn your PDF publications into a flip-book with our unique Google optimized e-Paper software.
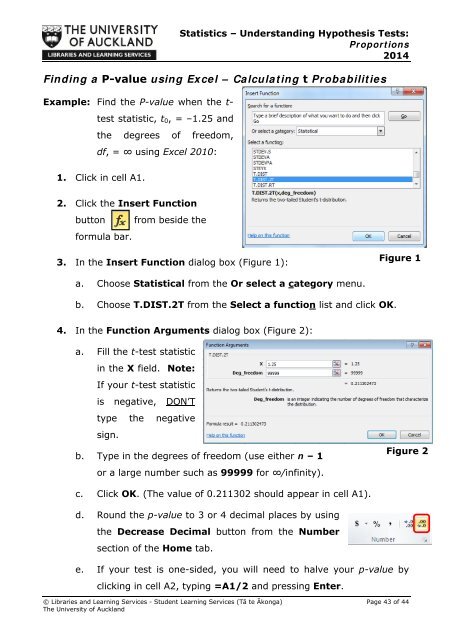
Statistics – Understanding Hypothesis Tests:Proportions2014Finding a P-value using Excel – Calculating t ProbabilitiesExample: Find the P-value when the t-test statistic, t 0 , = –1.25 andthe degrees of freedom,df, = ∞ using Excel 2010:1. Click in cell A1.2. Click the Insert Functionbutton from beside theformula bar.3. In the Insert Function dialog box (Figure 1):Figure 1a. Choose Statistical from the Or select a category menu.b. Choose T.DIST.2T from the Select a function list and click OK.4. In the Function Arguments dialog box (Figure 2):a. Fill the t-test statisticin the X field. Note:If your t-test statisticis negative, DON’Ttype the negativesign.b. Type in the degrees of freedom (use either n – 1or a large number such as 99999 for ∞/infinity).Figure 2c. Click OK. (The value of 0.211302 should appear in cell A1).d. Round the p-value to 3 or 4 decimal places by usingthe Decrease Decimal button from the Numbersection of the Home tab.e. If your test is one-sided, you will need to halve your p-value byclicking in cell A2, typing =A1/2 and pressing Enter.© Libraries and Learning Services - Student Learning Services (Tā te Ākonga) Page 43 of 44The University of Auckland


