STATISTICS â UNDERSTANDING HYPOTHESIS TESTS
STATISTICS â UNDERSTANDING HYPOTHESIS TESTS
STATISTICS â UNDERSTANDING HYPOTHESIS TESTS
Create successful ePaper yourself
Turn your PDF publications into a flip-book with our unique Google optimized e-Paper software.
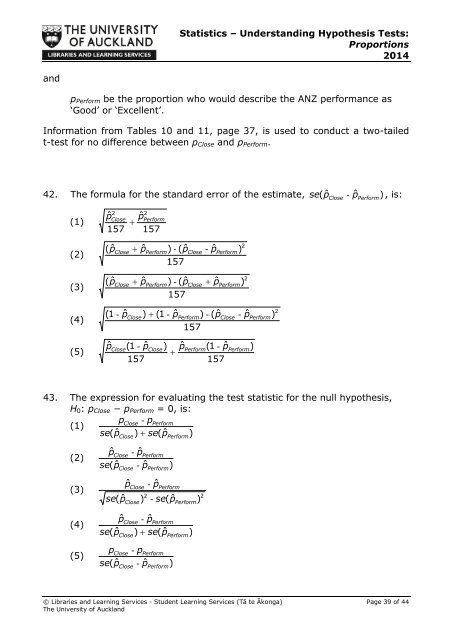
Statistics – Understanding Hypothesis Tests:Proportions2014andp Perform be the proportion who would describe the ANZ performance as‘Good’ or ‘Excellent’.Information from Tables 10 and 11, page 37, is used to conduct a two-tailedt-test for no difference between p Close and p Perform .42. The formula for the standard error of the estimate, se pˆClose- pˆ), is:(Perform(1)(2)22pˆClosepˆ Perform157 157(ˆ p ˆ ) (ˆ ˆClose pPerform- pClose- p157Perform)2(3)(ˆ pClose pˆPerform)- (ˆ p157Close pˆPerform)2(4)(5)(1 - pˆ) (1 ˆ ) (ˆ ˆClose - pPerform- pClose- p157pˆ(1 ˆ ) ˆ (1 ˆClose- pClosepPerform- p157157PerformPerform))243. The expression for evaluating the test statistic for the null hypothesis,H 0 : p Close − p Perform = 0, is:pClose- pPerform(1)se pˆ) se(ˆp )(ClosePerform(2)(3)(4)(5)pˆse(ˆpCloseClosese(ˆppˆse(ˆppse pˆpˆ- pˆ- pˆCloseCloseCloseClose))Perform2Perform- pˆ)Perform- se(ˆp- pˆ se(ˆp- p- pˆPerformClose Perform(Close PerformPerformPerform)))2© Libraries and Learning Services - Student Learning Services (Tā te Ākonga) Page 39 of 44The University of Auckland


