

STATISTICS â UNDERSTANDING HYPOTHESIS TESTS
STATISTICS â UNDERSTANDING HYPOTHESIS TESTS
STATISTICS â UNDERSTANDING HYPOTHESIS TESTS

You also want an ePaper? Increase the reach of your titles
YUMPU automatically turns print PDFs into web optimized ePapers that Google loves.
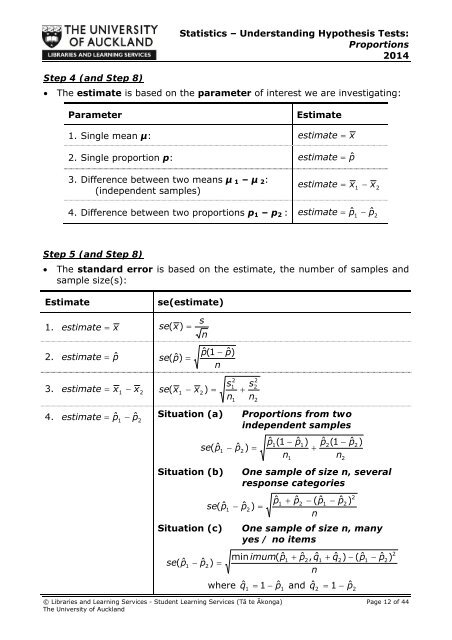
Step 4 (and Step 8)Statistics – Understanding Hypothesis Tests:Proportions2014 The estimate is based on the parameter of interest we are investigating:ParameterEstimate1. Single mean µ: estimate x2. Single proportion p: estimate pˆ3. Difference between two means µ 1 – µ 2:(independent samples)estimatex 1 x 24. Difference between two proportions p 1 – p 2 : estimate pˆˆ1 p2Step 5 (and Step 8) The standard error is based on the estimate, the number of samples andsample size(s):Estimatese(estimate)1. estimate xse(x)sn2. estimate pˆse(ˆ)p pˆ(1npˆ)3. estimate x 1 x2se(x1 x2)sn© Libraries and Learning Services - Student Learning Services (Tā te Ākonga) Page 12 of 44The University of Auckland211sn4. estimate pˆˆ1 p Situation (a) Proportions from two2independent samplesse(ˆp1Situation (b)se(ˆpSituation (c)se(ˆp12222 pˆ) 1pˆ ˆ1(1 p1)n1pˆˆ2(1 pnOne sample of size n, severalresponse categories pˆ) 2pˆ1 pˆ2 (ˆ pn12 pˆ)One sample of size n, manyyes / no itemsmin imum(ˆp1 pˆ2,qˆ1 qˆ2) (ˆ p1 pˆ2)nwhere qˆˆ1 1 p1and qˆˆ2 1 p2222) pˆ)22


