

STATISTICS â UNDERSTANDING HYPOTHESIS TESTS
STATISTICS â UNDERSTANDING HYPOTHESIS TESTS
STATISTICS â UNDERSTANDING HYPOTHESIS TESTS

Create successful ePaper yourself
Turn your PDF publications into a flip-book with our unique Google optimized e-Paper software.
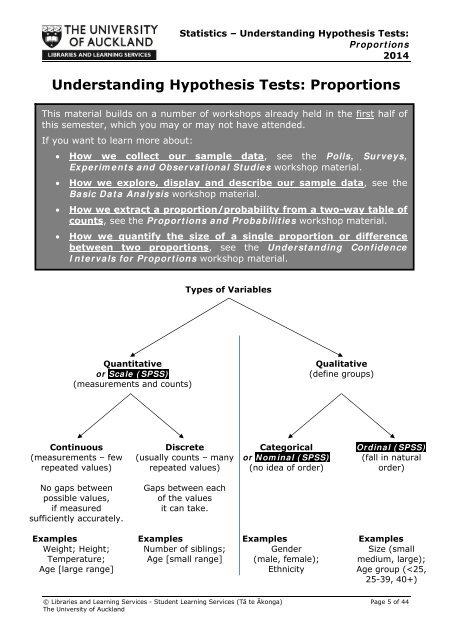
Statistics – Understanding Hypothesis Tests:Proportions2014Understanding Hypothesis Tests: ProportionsThis material builds on a number of workshops already held in the first half ofthis semester, which you may or may not have attended.If you want to learn more about: How we collect our sample data, see the Polls, Surveys,Experiments and Observational Studies workshop material.How we explore, display and describe our sample data, see theBasic Data Analysis workshop material.How we extract a proportion/probability from a two-way table ofcounts, see the Proportions and Probabilities workshop material.How we quantify the size of a single proportion or differencebetween two proportions, see the Understanding ConfidenceIntervals for Proportions workshop material.Types of VariablesQuantitativeor Scale (SPSS)(measurements and counts)Qualitative(define groups)Continuous(measurements – fewrepeated values)Discrete(usually counts – manyrepeated values)Categoricalor Nominal (SPSS)(no idea of order)Ordinal (SPSS)(fall in naturalorder)No gaps betweenpossible values,if measuredsufficiently accurately.Gaps between eachof the valuesit can take.ExamplesWeight; Height;Temperature;Age [large range]ExamplesNumber of siblings;Age [small range]ExamplesGender(male, female);EthnicityExamplesSize (smallmedium, large);Age group (


