STATISTICS â UNDERSTANDING HYPOTHESIS TESTS
STATISTICS â UNDERSTANDING HYPOTHESIS TESTS
STATISTICS â UNDERSTANDING HYPOTHESIS TESTS
Create successful ePaper yourself
Turn your PDF publications into a flip-book with our unique Google optimized e-Paper software.
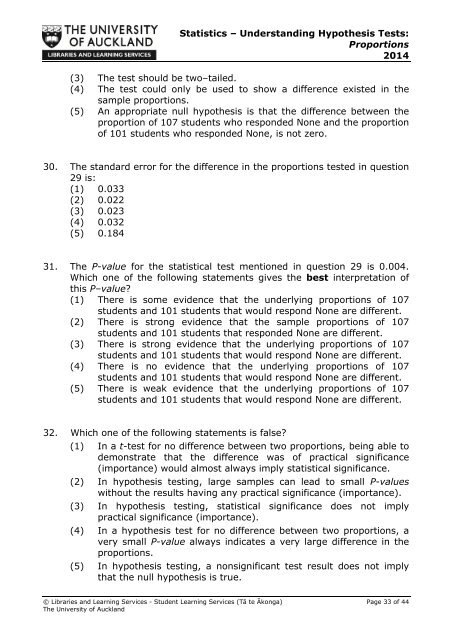
Statistics – Understanding Hypothesis Tests:Proportions2014(3) The test should be two–tailed.(4) The test could only be used to show a difference existed in thesample proportions.(5) An appropriate null hypothesis is that the difference between theproportion of 107 students who responded None and the proportionof 101 students who responded None, is not zero.30. The standard error for the difference in the proportions tested in question29 is:(1) 0.033(2) 0.022(3) 0.023(4) 0.032(5) 0.18431. The P-value for the statistical test mentioned in question 29 is 0.004.Which one of the following statements gives the best interpretation ofthis P–value?(1) There is some evidence that the underlying proportions of 107students and 101 students that would respond None are different.(2) There is strong evidence that the sample proportions of 107students and 101 students that responded None are different.(3) There is strong evidence that the underlying proportions of 107students and 101 students that would respond None are different.(4) There is no evidence that the underlying proportions of 107students and 101 students that would respond None are different.(5) There is weak evidence that the underlying proportions of 107students and 101 students that would respond None are different.32. Which one of the following statements is false?(1) In a t-test for no difference between two proportions, being able todemonstrate that the difference was of practical significance(importance) would almost always imply statistical significance.(2) In hypothesis testing, large samples can lead to small P-valueswithout the results having any practical significance (importance).(3) In hypothesis testing, statistical significance does not implypractical significance (importance).(4) In a hypothesis test for no difference between two proportions, avery small P-value always indicates a very large difference in theproportions.(5) In hypothesis testing, a nonsignificant test result does not implythat the null hypothesis is true.© Libraries and Learning Services - Student Learning Services (Tā te Ākonga) Page 33 of 44The University of Auckland


