

STATISTICS â UNDERSTANDING HYPOTHESIS TESTS
STATISTICS â UNDERSTANDING HYPOTHESIS TESTS
STATISTICS â UNDERSTANDING HYPOTHESIS TESTS

You also want an ePaper? Increase the reach of your titles
YUMPU automatically turns print PDFs into web optimized ePapers that Google loves.
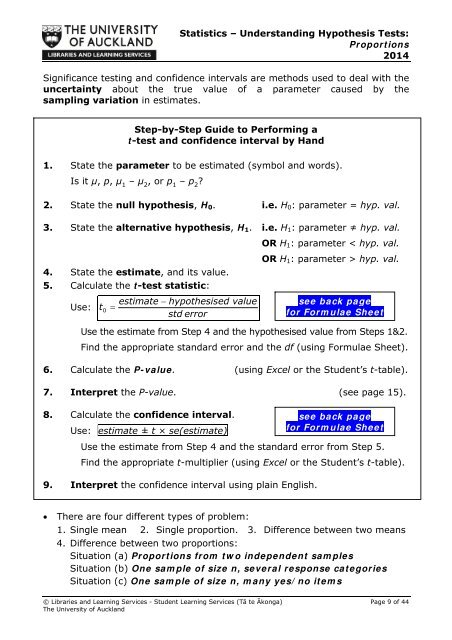
Statistics – Understanding Hypothesis Tests:Proportions2014Significance testing and confidence intervals are methods used to deal with theuncertainty about the true value of a parameter caused by thesampling variation in estimates.Step-by-Step Guide to Performing at-test and confidence interval by Hand1. State the parameter to be estimated (symbol and words).Is it µ, p, µ 1– µ 2, or p 1– p 2?2. State the null hypothesis, H 0 . i.e. H 0 : parameter = hyp. val.3. State the alternative hypothesis, H 1 . i.e. H 1 : parameter ≠ hyp. val.OR H 1 : parameter < hyp. val.4. State the estimate, and its value.5. Calculate the t-test statistic:OR H 1 : parameter > hyp. val.Use:t0estimate hypothesised valuestd errorsee back pagefor Formulae SheetUse the estimate from Step 4 and the hypothesised value from Steps 1&2.Find the appropriate standard error and the df (using Formulae Sheet).6. Calculate the P-value. (using Excel or the Student’s t-table).7. Interpret the P-value. (see page 15).8. Calculate the confidence interval.Use: estimate ± t × se(estimate)see back pagefor Formulae SheetUse the estimate from Step 4 and the standard error from Step 5.Find the appropriate t-multiplier (using Excel or the Student’s t-table).9. Interpret the confidence interval using plain English.There are four different types of problem:1. Single mean 2. Single proportion. 3. Difference between two means4. Difference between two proportions:Situation (a) Proportions from two independent samplesSituation (b) One sample of size n, several response categoriesSituation (c) One sample of size n, many yes/no items© Libraries and Learning Services - Student Learning Services (Tā te Ākonga) Page 9 of 44The University of Auckland


