

STATISTICS â UNDERSTANDING HYPOTHESIS TESTS
STATISTICS â UNDERSTANDING HYPOTHESIS TESTS
STATISTICS â UNDERSTANDING HYPOTHESIS TESTS

You also want an ePaper? Increase the reach of your titles
YUMPU automatically turns print PDFs into web optimized ePapers that Google loves.
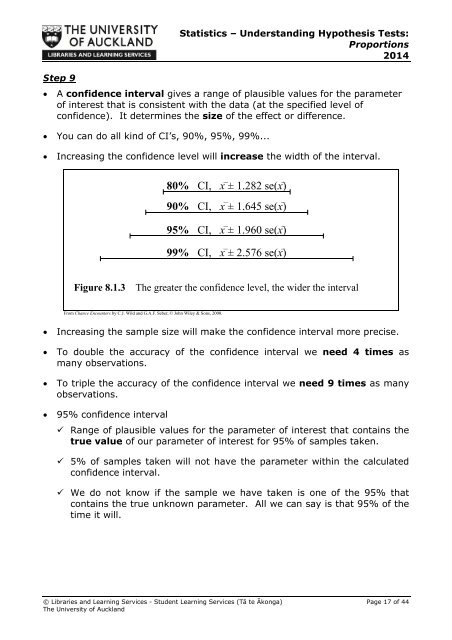
Step 9Statistics – Understanding Hypothesis Tests:Proportions2014A confidence interval gives a range of plausible values for the parameterof interest that is consistent with the data (at the specified level ofconfidence). It determines the size of the effect or difference. You can do all kind of CI’s, 90%, 95%, 99%...Increasing the confidence level will increase the width of the interval.80% CI, x ± 1.282 se(x)90% CI, x ± 1.645 se(x)95% CI, x ± 1.960 se(x)99% CI, x ± 2.576 se(x)Figure 8.1.3The greater the confidence level, the wider the intervalFrom Chance Encounters by C.J. Wild and G.A.F. Seber, © John Wiley & Sons, 2000.Increasing the sample size will make the confidence interval more precise.To double the accuracy of the confidence interval we need 4 times asmany observations.To triple the accuracy of the confidence interval we need 9 times as manyobservations.95% confidence interval Range of plausible values for the parameter of interest that contains thetrue value of our parameter of interest for 95% of samples taken. 5% of samples taken will not have the parameter within the calculatedconfidence interval. We do not know if the sample we have taken is one of the 95% thatcontains the true unknown parameter. All we can say is that 95% of thetime it will.© Libraries and Learning Services - Student Learning Services (Tā te Ākonga) Page 17 of 44The University of Auckland


