

STATISTICS â UNDERSTANDING HYPOTHESIS TESTS
STATISTICS â UNDERSTANDING HYPOTHESIS TESTS
STATISTICS â UNDERSTANDING HYPOTHESIS TESTS

Create successful ePaper yourself
Turn your PDF publications into a flip-book with our unique Google optimized e-Paper software.
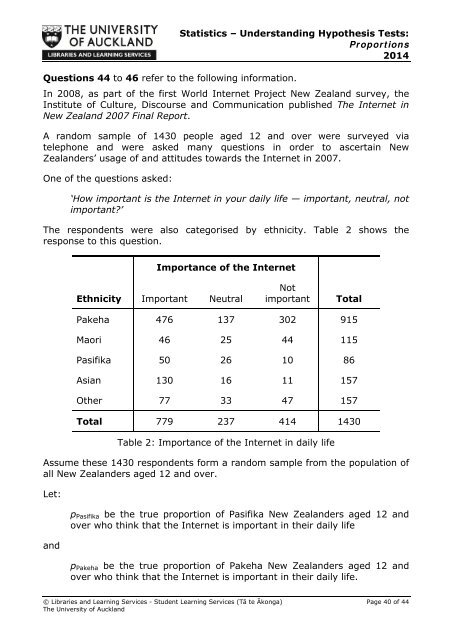
Statistics – Understanding Hypothesis Tests:Proportions2014Questions 44 to 46 refer to the following information.In 2008, as part of the first World Internet Project New Zealand survey, theInstitute of Culture, Discourse and Communication published The Internet inNew Zealand 2007 Final Report.A random sample of 1430 people aged 12 and over were surveyed viatelephone and were asked many questions in order to ascertain NewZealanders’ usage of and attitudes towards the Internet in 2007.One of the questions asked:‘How important is the Internet in your daily life — important, neutral, notimportant?’The respondents were also categorised by ethnicity. Table 2 shows theresponse to this question.Importance of the InternetEthnicityImportantNeutralNotimportantTotalPakeha 476 137 302 915Maori 46 25 44 115Pasifika 50 26 10 86Asian 130 16 11 157Other 77 33 47 157Total 779 237 414 1430Table 2: Importance of the Internet in daily lifeAssume these 1430 respondents form a random sample from the population ofall New Zealanders aged 12 and over.Let:andp Pasifika be the true proportion of Pasifika New Zealanders aged 12 andover who think that the Internet is important in their daily lifep Pakeha be the true proportion of Pakeha New Zealanders aged 12 andover who think that the Internet is important in their daily life.© Libraries and Learning Services - Student Learning Services (Tā te Ākonga) Page 40 of 44The University of Auckland


