

STATISTICS â UNDERSTANDING HYPOTHESIS TESTS
STATISTICS â UNDERSTANDING HYPOTHESIS TESTS
STATISTICS â UNDERSTANDING HYPOTHESIS TESTS

You also want an ePaper? Increase the reach of your titles
YUMPU automatically turns print PDFs into web optimized ePapers that Google loves.
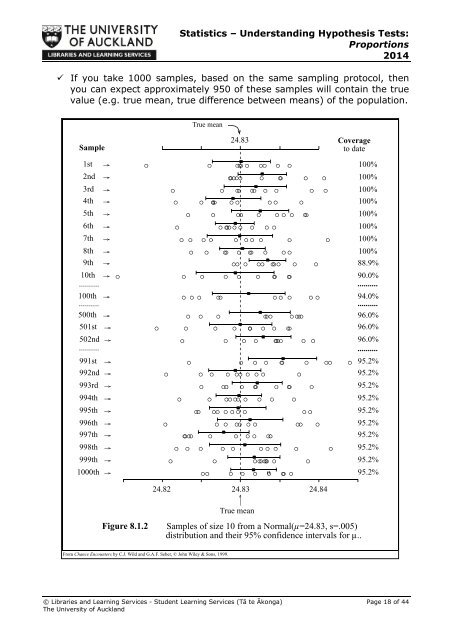
Statistics – Understanding Hypothesis Tests:Proportions2014 If you take 1000 samples, based on the same sampling protocol, thenyou can expect approximately 950 of these samples will contain the truevalue (e.g. true mean, true difference between means) of the population.Sample1st2nd3rd4th5th6th7th8th9th100th..........500th24.8310th90.0%.......... ..........501st502nd..........991st992nd993rd994th995th996th997th998th999th1000thTrue meanoCoverageto date100%100%100%100%100%100%100%100%88.9%94.0%..........96.0%96.0%96.0%..........95.2%95.2%95.2%95.2%95.2%95.2%95.2%95.2%95.2%95.2%24.8224.8324.84Figure 8.1.2True meanSamples of size 10 from a Normal(µ=24.83, s=.005)distribution and their 95% confidence intervals for µ..From Chance Encounters by C.J. Wild and G.A.F. Seber, © John Wiley & Sons, 1999.© Libraries and Learning Services - Student Learning Services (Tā te Ākonga) Page 18 of 44The University of Auckland


